10-K: Annual report pursuant to Section 13 and 15(d)
Published on March 16, 2023
o
UNITED STATES
SECURITIES AND EXCHANGE COMMISSION
Washington, D.C. 20549
FORM
(Mark One)
For the fiscal year ended
OR
For the transition period from to
Commission File Number
(Exact name of registrant as specified in its charter)
|
||
|
(State or other jurisdiction of incorporation or organization) |
|
(I.R.S. Employer Identification No.) |
|
|
|
|
||
(Address of principal executive offices) |
|
(Zip Code) |
|
|
|
Registrant’s telephone number, including area code: (
Securities registered pursuant to Section 12(b) of the Act:
Title of Each Class |
|
Trading Symbol |
|
Name of Each Exchange on Which Registered |
|
|
Securities registered pursuant to Section 12(g) of the Act: None
Indicate by check mark if the registrant is a well-known seasoned issuer, as defined in Rule 405 of the Securities Act. Yes ☐
Indicate by check mark if the registrant is not required to file reports pursuant to Section 13 or Section 15(d) of the Act. Yes ☐
Indicate by check mark whether the registrant: (1) has filed all reports required to be filed by Section 13 or 15(d) of the Securities Exchange Act of 1934 during the preceding 12 months (or for such shorter period that the registrant was required to file such reports), and (2) has been subject to such filing requirements for the past 90 days.
Indicate by check mark whether the registrant has submitted electronically every Interactive Data File required to be submitted pursuant to Rule 405 of Regulation S-T (§232.405 of this chapter) during the preceding 12 months (or for such shorter period that the registrant was required to submit such files).
Indicate by check mark whether the registrant is a large accelerated filer, an accelerated filer, a non-accelerated filer, a smaller reporting company, and an emerging growth company. See the definitions of “large accelerated filer,” “accelerated filer,” “smaller reporting company,” and “emerging growth company” in Rule 12b-2 of the Exchange Act.
Large accelerated filer |
☐ |
☒ |
|
Non-accelerated filer |
☐ |
Smaller reporting company |
|
|
|
Emerging growth company |
If an emerging growth company, indicate by check mark if the registrant has elected not to use the extended transition period for complying with any new or revised financial accounting standards provided pursuant to Section 13(a) of the Exchange Act. ☐
Indicate by check mark whether the registrant has filed a report on and attestation to its management’s assessment of the effectiveness of its internal control over financial reporting under Section 404(b) of the Sarbanes-Oxley Act (15 U.S.C. 7262(b)) by the registered public accounting firm that prepared or issued its audit report.
If securities are registered pursuant to Section 12(b) of the Act, indicate by check mark whether the financial statements of the registrant included in the filing reflect the correction of an error to previously issued financial statements. ☐
Indicate by check mark whether any of those error corrections are restatements that required a recovery analysis of incentive-based compensation received by any of the registrant’s executive officers during the relevant recovery period pursuant to §240.10D-1(b). ☐
Indicate by check mark whether the registrant is a shell company (as defined in Rule 12b-2 of the Act). Yes
As of June 30, 2022, the last business day of the registrant’s most recently completed second fiscal quarter, the aggregate market value of the registrant's common stock held by non-affiliates was approximately $
As of March 10, 2023,
DOCUMENTS INCORPORATED BY REFERENCE
TABLE OF CONTENTS
|
|
|
Page |
|
|
|
|
|
ii |
||
|
iv |
||
|
|
|
|
PART I |
|
|
|
Item 1. |
|
1 |
|
Item 1A. |
|
12 |
|
Item 1B. |
|
31 |
|
Item 2. |
|
31 |
|
Item 3. |
|
31 |
|
Item 4. |
|
31 |
|
|
|
|
|
PART II |
|
|
|
Item 5. |
|
32 |
|
Item 6. |
|
32 |
|
Item 7. |
Management’s Discussion and Analysis of Financial Condition and Results of Operations |
|
33 |
Item 7A. |
|
48 |
|
Item 8. |
|
49 |
|
Item 9. |
Changes in and Disagreements With Accountants on Accounting and Financial Disclosure |
|
96 |
Item 9A. |
|
96 |
|
Item 9B. |
|
99 |
|
Item 9C. |
Disclosure Regarding Foreign Jurisdictions that Prevent Inspections |
|
99 |
|
|
|
|
PART III |
|
|
|
Item 10. |
|
100 |
|
Item 11. |
|
100 |
|
Item 12. |
Security Ownership of Certain Beneficial Owners and Management and Related Stockholder Matters |
|
100 |
Item 13. |
Certain Relationships and Related Transactions, and Director Independence |
|
100 |
Item 14. |
|
100 |
|
|
|
|
|
PART IV |
|
|
|
Item 15. |
|
101 |
|
Item 16. |
|
104 |
|
|
105 |
||
i
CAUTIONARY NOTE REGARDING FORWARD-LOOKING STATEMENTS
This Annual Report on Form 10-K contains certain forward-looking statements within the meaning of Section 27A of the Securities Act of 1933, as amended (the “Securities Act”) and Section 21E of the Securities Exchange Act of 1934, as amended (the “Exchange Act”), and we intend that such forward-looking statements be subject to the safe harbors created thereby. All statements made in this Annual Report on Form 10-K that are not statements of historical fact are forward-looking statements. Without limiting the generality of the foregoing, words such as “anticipates,” “believes,” “seeks,” “estimates,” “expects,” “intends,” “continue,” “can,” “may,” “plans,” “potential,” “projects,” “should,” “could,” “will,” “would” or similar expressions and the negatives of those expressions may identify forward-looking statements, although not all forward-looking statements contain these identifying words. Such forward-looking statements include, but are not limited to, any statements that refer to projections of our future financial condition and results of operations, capital needs and financing plans, competitive position, industry environment, potential growth and market opportunities, acquisition plans and strategies, compensation plans, governance structure and policies and/or the price of our common stock.
The forward-looking statements included herein represent our management’s current expectations and assumptions based on information available as of the date of this report. These statements involve numerous known and unknown risks, uncertainties and other factors that may cause our actual results, performance or achievements to be materially different from any future results, performance or achievements expressed or implied by the forward-looking statements. Factors that may cause or contribute to such differences include, but are not limited to:
All forward-looking statements are necessarily only estimates of future results, and there can be no assurance that actual results will not differ materially from expectations. You should carefully review these risks, as well as the additional risks described in other documents we file from time to time with the Securities and Exchange Commission (“SEC”). In light of the significant risks and uncertainties inherent in the forward-looking information included herein, the inclusion of such information should not be regarded as a representation by us or any other person that such results will be achieved, and readers are cautioned not to place undue reliance on such forward-looking information, which speak only as of the date of this report.
Moreover, we operate in an evolving environment. New risks and uncertainties emerge from time to time, and it is not possible for our management to predict all risks and uncertainties, nor can we assess the impact of all factors on our business or the extent to which any factor, or combination of factors, may cause actual future results to be materially different from those expressed or implied by any forward-looking statements.
ii
Except as required by law, we assume no obligation to update any forward-looking statements, or to update the reasons actual results could differ materially from those anticipated in these forward-looking statements, even if new information becomes available in the future. We qualify all of our forward-looking statements by these cautionary statements.
iii
SUMMARY OF RISK FACTORS
Investing in our common stock involves a high degree of risk. Below is a summary of certain material factors that could harm our business, operating results and/or financial condition, impair our future prospects, and/or cause the price of our common stock to decline. Please refer to the additional discussion of the risks summarized below in Item 1A (Risk Factors) of Part I of this Annual Report on Form 10-K, which should be carefully considered, together with other information in this Annual Report on Form 10-K and in our other filings with the SEC, before making an investment decision regarding our common stock.
Risks Related to Our Business and Our Financial Condition
Risks Related to the Development and Operation of Our aiWARE Platform and other Products
iv
Risks Related to Target Markets, Competition and Customers
Risks Related to Intellectual Property
Risks Related to Regulatory Compliance
Risks Related to the Ownership of Our Securities and Our Public Company Operations
There are additional risks related to the ownership of our securities and our public company operations discussed in more detail in item “Item 1A. Risk Factors” of Part I, including, but not limited to, risks concerning the volatility of our stock price, our identification of a material weakness in our internal control over financial reporting, our anti-takeover provisions, stockholder dilution and analysts’ reports about the Company.
v
PART I
Item 1. Business.
Overview
Veritone, Inc. (collectively with our subsidiaries, referred to as “Veritone,” “Company,” “we,” “our,” and “us”) is a leading provider of artificial intelligence (“AI”) computing solutions and services. We are driven by the belief that AI is key to building a safer, more efficient, transparent and empowered society. Our mission is to be an active contributor to making the world better through AI. As creators of one of the world’s first AI operating systems, we are augmenting the human workforce by transforming use-case concepts into tangible, industry-leading applications and solutions.
Our proprietary AI operating system, aiWARETM, uses machine learning algorithms, or AI models, together with a suite of powerful applications, to reveal valuable insights from vast amounts of structured and unstructured data. aiWARE serves as the foundation for our AI solutions and bespoke applications and offers access to hundreds of cognitive engines through one common software infrastructure. Highly modular and customizable, aiWARE enables expansive scale with the flexibility to deploy in the cloud, at the edge or in hybrid environments. Our aiWARE platform offers capabilities that mimic human cognitive functions such as perception, prediction and problem solving, enabling users to quickly, efficiently and cost effectively transform unstructured data into structured data, and analyze and optimize data to drive business processes and insights. aiWARE is based on an open architecture that enables new AI models, applications and workflows to be added quickly and efficiently, resulting in a scalable and evolving solution that can be leveraged by organizations across a range of industries.
We also offer cloud-native digital content management solutions and content licensing services, primarily to customers in the media and entertainment market. These offerings utilize aiWARE, providing customers with unique capabilities to enrich and drive expanded revenue opportunities from their content.
In addition, we operate a full-service advertising agency that leverages aiWARE to provide differentiated managed services to our customers. Our advertising services include media planning and strategy, advertisement buying and placement, campaign messaging, clearance verification and attribution, and custom analytics, specializing in host-endorsed and influencer advertising across radio, podcasting, streaming audio, social media and other digital media channels. Our advertising services also include our VeriAds Network, which is comprised of programs that enable broadcasters, podcasters and social media influencers to generate incremental advertising revenue. In March 2022, we acquired an influencer-based management company to augment and accelerate our advertising services and capabilities.
In September 2021, we acquired PandoLogic. Ltd. (“PandoLogic”), a company incorporated under the laws of the state of Israel, which is a leading provider of intelligent hiring solutions and utilizes its proprietary platform, PandoIQ, to accelerate the time and improve efficiency for employers hiring at scale for both mass market and difficult-to-source candidates. PandoLogic’s fully autonomous recruiting platform helps employers source talent faster and more efficiently with predictive algorithms, machine learning and AI.
We generate revenue primarily through the delivery of our Software Products & Services (as defined below) across our Commercial Enterprise (“Commercial Enterprise”) and Government and Regulated Industries (“Government & Regulated Industries”) divisions, and secondarily from Managed Services (as defined below) that today include the delivery of advertising and content licensing services within Commercial Enterprise.
Our presence is primarily in the United States and Israel.
The Market Opportunity
Today, unstructured data is growing rapidly and Gartner clients are reporting 30% to 60% growth in unstructured data year over year (2022 Strategic Roadmap for Storage, March 2022). This creates significant challenges for companies and
1
governments across the globe, including how to create systematic solutions to address the ever-increasing volume of unstructured data. Whether it is a local police department trying to rapidly solve crimes through analysis of video evidence, a media company searching years of television archives for specific images and video content, or the U.S. military trying to analyze huge volumes of satellite and other aerial images, we believe AI is the only efficient solution to these complex challenges.
To address the ever-growing challenges surrounding unstructured data, we developed aiWARE, our proprietary AI operating system. aiWARE orchestrates AI models, together with a suite of powerful applications, to reveal valuable insights from vast amounts of structured and unstructured data. aiWARE offers capabilities that mimic human cognitive functions such as perception, prediction, problem solving and optimization, enabling users to quickly, efficiently and cost effectively transform unstructured data into structured data, and analyze and optimize data to drive business processes and insights.
Our Solution
aiWARE is based on an open architecture that enables new AI models, applications and workflows to be added quickly and efficiently. This results in a scalable and evolving solution that can be easily leveraged by organizations in a broad range of industries that capture or use audio, video and other unstructured data, together with structured data, such as the media and entertainment, government, legal and compliance, and other vertical markets, driving down the cost, complexity and time to develop, deploy and distribute AI-enabled applications in their operations. Our aiWARE platform is offered primarily through a software-as-a-service (“SaaS”) delivery model and can be deployed in a number of environments and configurations to meet our customers’ needs.
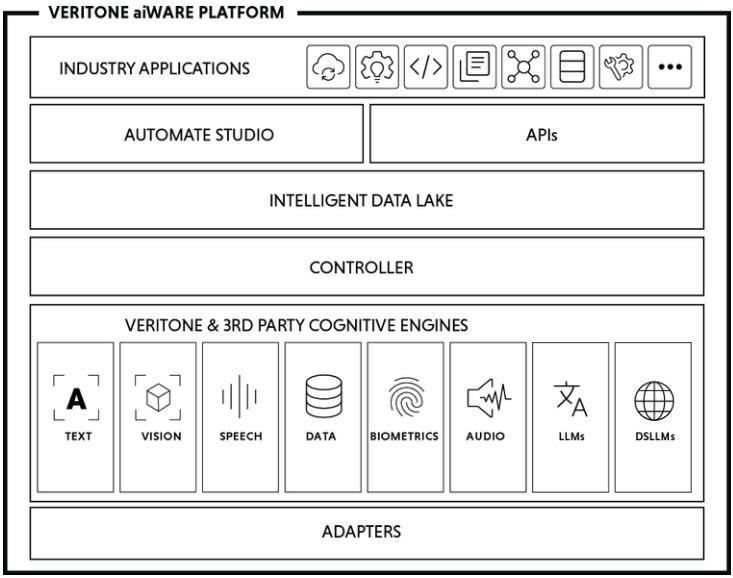
Our aiWARE platform encompasses the following:
2
aiWARE is available through multiple deployment models that can be configured to meet each customer’s specific requirements. These deployment models include fully cloud-based options hosted by us in Amazon Web Services (“AWS”) and Microsoft Azure (“Azure”) commercial and secure government cloud environments; on-premises options, which allow users to utilize aiWARE’s cognitive processing and certain other capabilities in their controlled environment; and hybrid cloud/on-premises options, which give users of our on-premises capabilities the option to also connect to our services in the cloud, either to provision additional services to run within their controlled environment, or to use our additional cloud-based services to process data, search and analyze the results. We currently hold an Authorization to Operate (“ATO”) under the Federal Risk and Authorization Management Program (“FedRAMP”) for our AWS secure government cloud platform to support government customers.
Our current architecture gives us the flexibility to deploy many of aiWARE’s capabilities in virtually any environment, including select arm64 architectures, with improved scalability and reliability. We are continuing to enhance the portability of aiWARE to provide substantially all of the features and functionality of the platform within any environment to meet our customers’ needs.
Markets in Which We Operate
We serve two distinct markets: Commercial Enterprise and Government & Regulated Industries. We have developed several applications and services addressing specific customer use cases within these target markets. We intend to leverage the capabilities that we have developed for these key markets to expand into other markets in the future. We have identified numerous ways in which our aiWARE platform and related AI technology may be used to extract valuable insights from large volumes of data to address real-world problems across a broad range of markets and applications.
Commercial Enterprise
Commercial Enterprise today consists of customers in the commercial sector, including media and entertainment, advertising, content licensing and hiring solutions customers. To date, the majority of our Software Products & Services and Managed Services revenue is generated from our Commercial Enterprise customers.
3
Software Products & Services
Software Products & Services used by our Commercial Enterprise customers include:
Managed Services
Managed Services used by our Commercial Enterprise customers include:
4
Government and Regulated Industries
Government & Regulated Industries today consists of customers in government and regulated industries, including our state, local and federal government, legal, compliance and, to a lesser extent, energy customers. To date, a small portion of our historical revenue is generated from Government & Regulated Industries customers; however, we believe that there are excellent near and long term opportunities in Government & Regulated Industries to grow our business.
Government & Regulated Industries markets include state and local government, legal and compliance markets, including law enforcement, legal and judicial professionals, and companies and regulatory bodies in highly regulated industries. Law enforcement and other government agencies regularly accumulate large amounts of unstructured audio and video data, including from police body cameras, police car recorders, interview room cameras, 911 audio tapes and surveillance cameras. Historically, in most cases, investigators have had to review audio and video data manually, a task that consumes huge amounts of time and delays investigations. In addition, public agencies are required to provide certain information, which may include audio and video files, in response to requests from the public. Recently, statutes in several states have broadened the scope of information required to be disclosed and have shortened the time periods in which such disclosures must be made. Reviewing video footage to identify and authenticate the appropriate footage to be disclosed, and to redact facial images and other sensitive information prior to disclosure, have historically been time-consuming and largely manual processes. Today, law enforcement and other government agencies can leverage our aiWARE platform and applications to organize, review, analyze and gain insight from their various data sources to greatly enhance their investigative workflows and to support their public disclosure requirements.
Within the legal market, our AI technologies support eDiscovery, the process of identifying, collecting and producing electronically stored information, where audio and video content analysis is playing an increasingly important role in civil litigation and criminal proceedings. Our aiWARE platform’s applications and cognitive capabilities enable users to quickly search and analyze large volumes of audio files, video files, text-based documents and other electronically stored information to identify particular words, phrases, faces, objects and voices, and to redact sensitive information prior to production, greatly increasing the speed, reducing the cost, and improving the results of discovery processes.
Software Products & Services used by our Government & Regulated Industries customers include:
5
Sales and Marketing
Software Products & Services
We conduct sales and marketing activities related to our Software Products & Services through a combination of our direct sales force and indirect channel partners such as value-added resellers (“VARs”), distributors, system integrators, managed services providers and referral partners. Our direct sales organization is comprised of teams of business development managers, account executives and sales managers, who are supported by sales development representatives, sales engineers, solutions architects and other inside sales personnel. These sales teams are generally organized based on their specialized knowledge and expertise within each of our target markets. Our sales team collaborates closely with our product marketing, management and development teams to evaluate and develop solutions to address the needs of customers.
We have also established, and we intend to continue to expand, an indirect sales channel comprised of VARs, distributors and referral partners. We have entered into agreements with channel partners located in the United States and internationally. These agreements generally provide the channel partners with discounts below our standard prices, have terms of one year which automatically renew on an annual basis, and are generally terminable by either party for convenience following a specified notice period. Substantially all of our agreements with channel partners are nonexclusive; however, we
6
allow channel partners to register sales opportunities through our deal registration program, in which case we may grant a channel partner priority to pursue an opportunity for a specified period of time, subject to certain conditions.
Managed Services
We conduct sales and marketing activities relating to our digital content licensing Managed Services business through our direct sales representatives who identify, develop and manage our relationships with strategic Commercial Enterprise customers in the advertising, entertainment/documentary and network broadcasting industries. We maintain our commerce web portal, where stock content and select libraries can be licensed and downloaded directly, but the majority of our business is driven through high-value libraries that require an approval process to gain access. We also cross-sell additional products and services, including media management and aiWARE, to our content licensor partners.
We market and sell our advertising Managed Services through a combination of our direct sales and indirect channel sales. We primarily market and sell directly to advertisers through outbound sales networking and client and partner referrals. Our indirect sales channel consists of referral partners who are mainly advertising agencies or marketing consultants who are unable to provide certain services to their clients, such as radio, podcast and YouTube placements. In addition to our sales efforts for new clients, we further expand sales opportunities and upsell through our campaign strategists who work directly with our advertising clients to optimize and enhance media spending on advertising campaigns.
Customers
Software Products & Services
We market and sell our Software Products & Services to customers in the Commercial Enterprise and Government & Regulated Industries markets. During 2022, ten customers accounted for approximately 76% of the total revenues from our Software Products & Services, with one customer accounting for approximately 58% of the total revenues from Software Products & Services. As we continue to grow our revenues from our Software Products & Services across our markets, we believe that our dependence on any single customer or group of customers will be reduced.
Managed Services
We market and sell our advertising Managed Services to customers that make significant investments in advertising, particularly in native and spot-based advertising campaigns delivered over broadcast radio, satellite audio, streaming audio, podcasting, digital video services and other social media channels. During 2022, ten advertising customers accounted for approximately 38% of the total revenues from our Managed Services, with one advertising customer accounting for approximately 11% of the total Managed Services revenues. We market and sell our content licensing Managed Services to customers such as major sports networks, advertising agencies, and film production companies that require high value content for their broadcasts and projects. During 2022, ten content licensing customers accounted for approximately 11% of the total Managed Services revenues.
Competition
Software Products & Services
The market for AI-enabled solutions is rapidly evolving and highly competitive, and we face competition from various sources, including large, well-capitalized technology companies such as Google, Microsoft, Amazon and Palantir. In the case of our hiring solutions, the market for talent acquisition software and services is highly competitive, rapidly evolving and fragmented, and we face competition from programmatic job advertising software companies, traditional human capital management (HCM) companies, companies primarily focused on offering applicant tracking systems, and providers of point solutions for specific use cases such as for recruitment marketing, and these companies include, without limitation, Oracle and SAP.
Our large competitors may have better brand name recognition, greater financial and engineering resources and larger sales and marketing teams than we have. As a result, these competitors may be able to develop and introduce, or acquire companies that may be able to develop and introduce, competing solutions and technologies that may have greater capabilities than ours or that are able to achieve greater customer acceptance, and they may be able to respond more quickly and effectively than we can to new or changing opportunities, technologies, standards or customer requirements. Some customers may also be hesitant to use a new platform and prefer to upgrade products offered by their incumbent platforms for
7
reasons including price, quality, sophistication, familiarity and global presence. In addition, we may compete with smaller competitors, including developers of AI models, who may develop their own solutions that perform similar services as our platform for specific use cases, as well as with systems integrators that aggregate and integrate cognitive solutions from multiple providers for their clients.
We believe the following competitive attributes are necessary for us to successfully compete in the AI industry for Commercial Enterprise and Government & Regulated Industries customers for our Software Products & Services:
We believe that we compete favorably on the basis of the factors listed above. We believe that few of our competitors currently compete directly with us across all of our cognitive capabilities and vertical markets, and that none of our competitors currently deploy an AI operating system with an open ecosystem comprised of a comparable number of multiple proprietary and third party AI models that can be accessed by customers from a single integrated platform.
Competitors for our Software Products & Services fall into the following primary categories:
Managed Services
Competitors of our advertising Managed Services are mainly traditional advertising agencies that are either large full-service agencies or smaller niche agencies with a particular specialization or focus, such as radio media placement or podcast advertising, as well as large consulting firms in the media industry. We believe that we currently, and will continue to, compete successfully against our competitors on several key factors. We are a leader in endorsed radio and podcast advertising services, and we leverage our platform to provide our customers with innovative technology that we believe provides them with better analytics and insights into their advertising campaigns than our competitors for superior advertising performance and optimization.
We do not currently face significant competition from third parties for our content licensing Managed Services, particularly in North America; however, many content owners choose to manage the licensing of their content in-house, and
8
content owners that we currently represent may choose to license their content directly in the future. We believe that we may face more competition in North America if new content licensing companies emerge or expand their business in the region. As we expand our content licensing services to international markets, we believe that we may face greater competition from established content licensing and talent management companies. We believe that our ability to use the cognitive capabilities of aiWARE to enrich and enhance the searchability of content, and to leverage relationships with existing customers and vendors across our Managed Services business, gives us a competitive advantage over other content licensing companies and allows us to achieve greater benefits for content owners than they can achieve through their own in-house efforts.
Research and Development
Our research and development organization is comprised of employees who are responsible for the design, development and testing of our AI and software solutions, including software engineers, quality engineers, data scientists, data engineers, product managers and user experience designers. Our research and development organization is generally organized in teams, with teams focused on our core aiWARE architecture and capabilities and other teams focused on solutions and applications that address specific use cases in our key markets. We focus our efforts on developing new features and expanding the core technologies that further enhance the usability, functionality, reliability, performance and flexibility of aiWARE, as well as allow us to operate in new vertical markets. In addition, we contract with select third-party engineering services to support development and quality assurance testing. We plan to continue to make significant investments in developing our AI technologies, expanding the functionality and capabilities of aiWARE and related solutions, and building new software capabilities.
Intellectual Property
We rely on a combination of patent, copyright, trademark and trade secret laws in the United States and other jurisdictions, as well as license agreements and other contractual protections, to protect our proprietary technology. We also rely on a number of registered and unregistered trademarks to protect our brand.
As of March 10, 2023, in the United States, we have 41 issued patents, which expire between 2030 and 2042, and have 12 patent applications pending for examination. As of such date, we also had 13 issued patents and 41 patent applications pending for examination in foreign jurisdictions (including international PCT applications), all of which are based on counterpart U.S. patent applications pursued by us. In addition, we have registered, or have applied for registration of, numerous trademarks, including Veritone and aiWARE, in the United States and in several foreign jurisdictions. We seek to protect our intellectual property rights by implementing a policy that requires our employees and independent contractors involved in development of intellectual property on our behalf to enter into agreements acknowledging that all works or other intellectual property generated or conceived by them on our behalf are our property, and assigning to us any rights, including intellectual property rights, that they may claim or otherwise have in those works or property, to the extent allowable under applicable law.
Seasonality
We experience seasonal fluctuations in our revenue and operating performance as a result of the utilization of our platform and associated revenues from our Software Products & Services. In particular, our hiring solutions revenues have historically been higher in the second half of each fiscal year, consistent with the hiring cycles of our larger customers. We also experience seasonality a result of factors such as the timing of large projects, the length and complexity of our sales cycles, trends impacting our target vertical markets and our revenue recognition policies and any changes we make to those policies. Within a given quarter, a higher proportion of our agreements are signed toward the end of such quarter. Although these seasonal factors are common in the technology industry, historical patterns should not be considered a reliable indicator of our future sales activity or performance.
Regulatory Environment
We are subject to a number of U.S. federal, state, local and foreign laws and regulations, including within Israel and parts of Europe, that involve matters central to our business. These laws and regulations involve privacy, data protection, intellectual property, competition, consumer protection and other subjects.
Our customers utilize our products and services to process, analyze and store data in a manner which may cause us to carry out certain processing of personal information that is subject to data protection and privacy laws in various jurisdictions including the European Union and United Kingdom General Data Protection Regulation (“GDPR”), the California Consumer Privacy Act (“CCPA”) laws regulating the use of AI, automated decision making, machine learning, and biometric technologies (including facial recognition), and similar laws and regulations in other jurisdictions, including states and
9
localities within the United States. Under these data protection and privacy laws, we are required to maintain appropriate technical and organizational measures to ensure the security and protection of personal data and information, and we must comply (either directly or indirectly pursuant to requirements of our contracts with customers) with a number of requirements with respect to individuals whose personal data or information we collect and process, including, among others, notification requirements and requirements to comply with requests from individuals to (i) opt out of collection, processing and/or sale of their data or information, (ii) delete their data or information, and (iii) receive copies of and other information regarding our collection and processing of their data or information.
The California Privacy Rights Act (“CPRA”) amends and expands the CCPA to include additional obligations of businesses with respect to collecting, processing and sharing personal information and responding to requests from consumers related to their personal information. Additionally, the CPRA applies to personal information of business representatives and employees. We are obligated to comply with the CPRA and the regulations to be implemented thereunder. Moreover, governments, regulators and individuals are increasingly scrutinizing the use of AI and machine learning technologies (including the associated processing of personal data), automated decision making (including in an employment and/or recruitment context), and the processing of biometric data (including through facial recognition technologies). Numerous laws and regulations around the world have been enacted or proposed to regulate these areas, and several lawsuits have been filed, particularly in the United States, challenging the processing of biometric data, which may reduce our customers’ demand for our products.
Human Capital Resources
As of March 10, 2023, we had a total of 661 employees, substantially all of whom were full-time employees. 217 of our U.S-based employees are located in California, with another 323 employees located in 40 other states. We also have 104 employees located in Israel, 14 in the United Kingdom, 1 in Singapore, 1 in Austria and 1 in the Netherlands.
We believe that our employees are our greatest asset and our company culture is a critical component of our success. We strive to create a diverse and inclusive work environment in which all employees feel a strong sense of community and embody our core values. 41% of our employees are women, and 18% of our employees are members of ethnic or racial minorities and other legally protected classes. We have implemented a number of initiatives to ensure that our employees are engaged and motivated to work hard and have fun at the same time. We conduct employee engagement surveys to gauge employee satisfaction, identify areas for improvement and implement positive change to evolve and better our company culture.
We strive to hire, develop and retain the top talent in the industry. To attract top talent, we offer competitive salaries, incentives, equity compensation and benefits. We conduct an annual talent review process, in which we obtain employee feedback, evaluate performance and establish goals, objectives and development plans for all employees. We continuously monitor and evaluate employee turnover to identify and address areas of concern to improve employee retention.
Company Information
We were incorporated as a Delaware corporation on June 13, 2014. Our corporate headquarters are located at 2420 17th Street, Office 3002, Denver, Colorado 80202. Our telephone number is (888) 507-1737. Our principal website address is www.veritone.com. The information provided on, or accessible through, our website is not a part of this Annual Report on Form 10-K, nor is such information incorporated by reference herein, and such information should not be relied upon in determining whether to make an investment in our common stock.
Available Information
This Annual Report on Form 10-K and our quarterly reports on Form 10-Q, current reports on Form 8-K and amendments to reports filed or furnished pursuant to Sections 13(a) and 15(d) of the Exchange Act, are available free of charge on the investor relations section of our website at investors.veritone.com as soon as reasonably practicable after we electronically file such material with, or furnish it to, the SEC. We will also provide electronic or paper copies of such reports free of charge, upon request made to our Corporate Secretary at 2420 17th Street, Office 3002, Denver, Colorado 80202. The SEC maintains an internet site that contains reports, proxy and information statements, and other information regarding issuers that file electronically with the SEC at http://www.sec.gov.
We use our investor relations website as a channel of distribution for important company information, including news and commentary about our business and financial performance, webcasts of our earnings calls and investor events, SEC
10
filings, and corporate governance information, including information regarding our board of directors, our board committee charters and code of business conduct and ethics. The information provided on, or accessible through, our investor relations website is not a part of this Annual Report on Form 10-K, nor is such information incorporated by reference herein, and such information should not be relied upon in determining whether to make an investment in our common stock.
11
Item 1A. Risk Factors.
The following describes the risks and uncertainties that could cause our actual results to differ materially from those presented in our forward-looking statements. The risks and uncertainties described below are not the only risks we face but do represent those risk and uncertainties that we believe are material to our business. Additional risks that we do not yet know of or that we currently believe are immaterial may also harm our business operations.
Risks Related to Our Business and Our Financial Condition
Our efforts to expand our aiWARE Software Products & Services may not be successful.
In order for us to grow our business and achieve profitability, we must expand our revenue base by expanding our customer base and increasing our business with existing customers. We may not be able to succeed with respect to these efforts. Many factors may adversely affect our ability to grow the business for our aiWARE platform, including but not limited to:
If we fail to develop a successful business for our aiWARE platform, our business, results of operations and financial condition will suffer.
The market for AI-based software applications is relatively new and unproven and may decline or experience limited growth. Concerns over the use of AI, including from regulators, the public and our customers, may hinder the adoption of AI technologies, which would adversely affect our ability to fully realize the potential of our Software Products & Services.
The market for AI-based software applications is still relatively new and evaluating the size and scope of the market is subject to a number of risks and uncertainties. We believe that our future success will depend in large part on the growth of this market. The utilization of our platform and solutions by customers is also still relatively new, and customers may not recognize the need for, or benefits of, our platform and solutions, which may prompt them to cease use of our platform and solutions or decide to adopt alternative products and services to satisfy their cognitive computing, search and analytics requirements. Our ability to access and extend our position in the markets that our platform and solutions are designed to address depends upon a number of factors, including the cost, performance and perceived value of our platform and solutions, as well as regulatory scrutiny over our products and technologies. As AI technologies become increasingly incorporated into various mainstream products and offerings, regulatory scrutiny of AI technologies, potentially including our
12
products, will likely increase. Market opportunity estimates are subject to significant uncertainty and are based on assumptions and estimates, including our internal analysis and industry experience. Assessing the market for our solutions is particularly difficult for several reasons, including limited available information and rapid evolution of the market.
In addition, AI presents risks and challenges that could hinder its further development, adoption and use in the markets that we serve. AI algorithms may be flawed, datasets may be insufficient or contain biased information, and the results and analyses that our AI solutions assist in producing may be deficient or inaccurate. Further, use of AI technologies in certain scenarios present ethical concerns. If we enable or offer AI solutions that produce deficient or inaccurate results and analyses, or that are controversial due to human rights, privacy or other social issues, we may experience lower-than-expected demand for our products and services, or competitive, brand or reputational harm.
If the market for AI-based solutions does not experience significant growth, or if demand for our platform or solutions does not increase in line with our projections, then our business, results of operations and financial condition will be adversely affected.
We may require additional capital to support our business growth, and this capital might not be available on acceptable terms, if at all.
We intend to continue to make investments to support our business, including the acquisition of complementary businesses or technologies, which may require additional funds. Accordingly, we may engage in equity and/or debt financings to secure additional funds. If we raise additional funds through future issuances of equity or convertible debt securities, our stockholders could suffer significant dilution, and any new equity securities we issue could have rights, preferences and privileges superior to those of holders of our common stock. Any debt financing that we may secure in the future could involve debt service obligations and restrictive covenants relating to our capital raising activities and other financial and operational matters, which may make it more difficult for us to obtain additional capital and to pursue business opportunities. We may not be able to obtain additional financing on terms favorable to us, if at all. If we are unable to obtain adequate financing or financing on terms satisfactory to us when we require it, our ability to continue to support our business growth, scale our infrastructure, develop product enhancements and to respond to business challenges could be significantly impaired, and our business, results of operations and financial condition may be adversely affected.
Certain of our operating results and financial metrics are difficult to predict and subject to volatility, including as a result of seasonality.
We experience quarterly variations in the timing of revenues from our Software Products & Services as a result of numerous factors, such as the timing of large projects, the length and complexity of our sales cycles and trends impacting our target vertical markets. In particular, our hiring solutions have historically experienced seasonality in terms of when we enter into customer agreements for our products and services. Consistent with the hiring patterns of our customers, a higher percentage of related revenue is earned in the second half of each year. Within a given quarter, often a significant portion of our agreements are signed toward the end of the quarter. This seasonality is reflected to a lesser extent in our revenue due to the fact that we generally recognize subscription revenue over the term of the customer agreement. We expect this seasonality to continue, which may cause fluctuations in certain of our operating results and financial metrics, and thus difficulties in predictability of our operating results.
We have had a history of losses and we may be unable to sustain profitability.
We experienced net losses of $25.6 million, $64.7 million, and $47.9 million in fiscal years 2022, 2021, and 2020, respectively. As of December 31, 2022, we had an accumulated deficit of $371.3 million. In each of the fourth quarters of 2022 and 2021, we generated a profit on a non-GAAP basis; however, we may not be able to sustain profitability throughout an entire fiscal year or in the future or at all. We expect to continue to expend substantial financial and other resources on, among other things:
13
These investments may not result in increased revenue or growth of our business. We may not be able to generate net revenues sufficient to offset our expected cost increases and planned investments in our business and platform. As a result, we may incur significant losses for the foreseeable future, and may not be able to achieve and sustain profitability. If we fail to achieve and sustain profitability, then we may not be able to achieve our business plan, fund our business or continue as a going concern.
We intend to continue to pursue the acquisition of other companies, businesses or technologies, which could be expensive, divert our management’s attention, fail to achieve the expected benefits and/or expose us to other risks or difficulties.
As part of our growth strategy, we have acquired, and we intend to continue to acquire, businesses, services, technologies or intellectual property rights that we believe could complement, expand or enhance the features and functionality of our aiWARE platform and our technical capabilities, broaden our product and service offerings or offer growth opportunities for our business. The pursuit of potential future acquisitions may divert the attention of management and cause us to incur various expenses in identifying, investigating and pursuing suitable acquisitions, whether or not such acquisitions are consummated. Acquisitions also could result in dilutive issuances of equity securities, the incurrence of debt, contingent liabilities, amortization expenses, impairment of goodwill and/or purchased long-lived assets, and restructuring charges, any of which could adversely affect our operating results and financial condition. In addition, we may face risks or experience difficulties in:
We also may not achieve the anticipated benefits from the acquired business and may incur unanticipated costs and liabilities in connection with any such acquisitions. Additionally, if we are unable to complete an acquisition, we could lose market share to competitors who are able to make such an acquisition. Once an acquisition is closed, we may discover hidden costs, resource demands and potential liabilities that were not evident throughout the due diligence process, particularly when such process is undertaken on an accelerated timeline. Although we utilize representation and warranty insurance and standard indemnity provisions in these acquisition transactions, if we are unable to successfully assert a claim, if a claim is not covered by insurance or if these hidden costs prove greater than expected, our operations as a whole may be adversely affected. In addition, a significant portion of the purchase price of companies we acquire may be allocated to acquired goodwill and other intangible assets, which must be assessed for impairment at least annually. If any of these results occurs, our business and financial results could be adversely affected.
We plan to expand our international operations, which exposes us to significant risks.
As part of our growth strategy, we plan to expand our operations internationally. We have operations in Israel and in Europe, and we expect, in the future, to open offices and hire employees in additional locations outside of the United States to reach new customers and gain access to additional technical talent. Operating in international markets requires significant resources and management attention and will subject us to additional regulatory, economic and political risks. Because of our limited experience with international operations as well as developing and managing sales in international markets, our international expansion efforts may not be successful. In addition, we will face risks of doing business internationally that could adversely affect our business, including, but not limited to:
14
Our failure to manage any of these risks successfully could harm our international operations, and adversely affect our business, results of operations and financial condition.
Our business has been and may continue to be negatively affected by the economic disruption caused by the COVID-19 pandemic and macroeconomic conditions, including increasing interest rates, inflationary pressures, the threat of recession and recent and potential future disruptions in access to bank deposits or lending commitments due to bank failures.
The COVID-19 outbreak emerged in late 2019 and was declared a global pandemic by the World Health Organization in March 2020. The ongoing COVID-19 pandemic has had, and may continue to have, a severe negative impact on the global economy.
The ultimate impact of the COVID-19 pandemic on our business, results of operations, financial condition and cash flows is dependent on future developments, including the duration of the pandemic in other countries such as China, the impact on the businesses of our customers, and the duration of any resulting negative macroeconomic conditions, all of which are uncertain and are difficult to predict at this time.
In addition to market disruptions caused by the COVID-19 pandemic, global economic and business activities continue to face widespread macroeconomic uncertainties, including labor shortages, inflation and monetary supply shifts, recession risks, disruptions from the Russia-Ukraine conflict and recent and potential future disruptions in access to bank deposits or lending commitments due to bank failures. We continue to actively monitor the impact of these macroeconomic factors on our financial condition, liquidity, operations, suppliers, industry and workforce, and instituted certain cost saving measures for the third and fourth quarters of fiscal year 2022 as a result of these factors. The extent of the impact of these factors on our operational and financial performance, including our ability to execute our business strategies and initiatives in the expected time frame, will depend on future developments, and the impact on our customers, partners and employees, all of which are uncertain and cannot be predicted. These and other global economic conditions, including any new disruptions, may negatively impact our business. Our hiring solutions are sold to businesses that experience performance fluctuations based on factors including the demand for labor and the economic health of current and prospective employers. To the extent that economic uncertainty or attenuated economic conditions cause our current and potential customers to freeze or reduce their headcount, demand for our products and services has been, and may continue to be negatively affected. Adverse economic conditions have also caused and could continue to result in reductions in sales of our applications, longer sales cycles, reductions in contract duration and value, slower adoption of new technologies and increased price competition. For example, beginning in March 2022, we experienced a reduction in hiring consumption from our largest customer, Amazon, and found that advertisers reduced spending across our managed services when compared to the same periods in the prior year. In addition, economic recessions have historically resulted in overall reductions in spending on software and technology solutions as well as pressure from customers and potential customers for extended billing terms. If economic, political, or market conditions deteriorate, or if there is uncertainty around these conditions, our current and potential customers may elect to decrease their software and technology solutions budgets by deferring or reconsidering product purchases, which could limit our ability to grow our business and negatively affect our operating results. Any of these events would likely have an adverse effect on our business, operating results and financial position.
Servicing our debt requires a significant amount of cash, and we may not have sufficient cash flow from our operations to pay our substantial debt obligations.
We issued an aggregate principal amount of $201.3 million of convertible senior notes in November 2021. In December 2022, we repurchased approximately $60.0 million of that debt at approximately 65% of par and, as of December 31, 2022, had $141.3 million aggregate principal amount of convertible senior notes outstanding. Our ability to make
15
scheduled payments of the principal of, to pay interest on and to refinance our indebtedness, including the convertible senior notes, depends on our future performance, which is subject to economic, financial, competitive and other factors beyond our control. Our business may not generate cash flow from operations in the future sufficient to service our debt and make necessary capital expenditures. If we are unable to generate such cash flow, we may be required to adopt one or more alternatives, such as selling assets, restructuring our debt or obtaining additional equity capital on terms that may be onerous or highly dilutive. Our ability to refinance our indebtedness will depend on the capital markets and our financial condition at such time. We may not be able to engage in any of these activities or engage in these activities on desirable terms, which could result in a default on our debt obligations.
We depend on our executive officers and other key employees, and the loss of one or more of these executive officers or key employees or an inability to attract and retain highly skilled employees could adversely affect our business.
Our success depends largely upon the continued services of our President and Chief Executive Officer, Ryan Steelberg, and our other executive officers and senior management. We rely on our leadership team in the areas of strategy and implementation, research and development, operations, security, marketing, sales, support and general and administrative functions. We do not currently have any employment agreements with our executive officers or senior management team that require them to continue to work for us for any specified period, and, therefore, they could terminate their employment with us at any time. The loss of Ryan Steelberg, or one or more of the members of our management team, could adversely impact our business and operations and disrupt our relationships with our key customers.
Our future success also depends, in part, on our ability to continue to attract and retain highly skilled personnel. We believe that there is, and will continue to be, intense competition for highly skilled management, engineering, data science, sales, marketing and other personnel with experience in the businesses in which we operate. We must provide competitive compensation packages and a high-quality work environment to hire, retain and motivate employees. If we are unable to retain and motivate our existing employees and attract qualified personnel to fill key positions, we may be unable to manage our business effectively, including the development, marketing, sale and delivery of our products and services, which could adversely affect our business, results of operations and financial condition.
Risks Related to the Development and Operation of Our aiWARE Platform and other Products
If we are not able to enhance our existing products or introduce new products that achieve market acceptance and keep pace with technological developments, our business, results of operations and financial condition could be harmed.
Our ability to attract new customers and increase revenue from existing customers depends in part on our ability to enhance and improve our aiWARE platform and applications and introduce new products and features, including enhancements necessary to provide substantially all of the features and functionality of the platform within a private cloud or on-premises environment, as well as new applications to address additional customer use cases. The success of any enhancements or new products depends on several factors, including timely development completion, adequate quality testing, actual performance quality, market-accepted pricing levels and overall market acceptance and demand. Enhancements and new products that we develop may not be introduced in a timely or cost-effective manner, may contain defects, may have interoperability difficulties with our aiWARE platform, or may not achieve the market acceptance necessary to generate significant revenue. If we are unable to successfully enhance our aiWARE platform and applications to meet evolving customer requirements and develop new products and applications, or if our efforts to increase the usage of our aiWARE platform are more expensive than we expect, then our business, results of operations and financial condition could be harmed.
Our competitors, partners or others may acquire third party technologies used in our aiWARE platform, which could result in them blocking us from using the technology in our aiWARE platform, offering it for free to the public or making it cost prohibitive for us to continue to incorporate their technologies in our aiWARE platform, or these third party technology providers may otherwise terminate their relationships with us, which could adversely affect the functionality of our aiWARE platform.
Our success depends in part on our ability to attract, incorporate and maintain high performing AI models on our aiWARE platform. If any third party acquires an AI model that is on our platform, they may preclude us from using it as a component of our platform or make it more expensive for us to utilize. In addition, a third-party AI model provider may terminate its relationship with us or may otherwise cease to make its AI models available to us. In either case, if that AI model has unique capabilities or a significant performance advantage over other models and we are unable to identify a suitable replacement model, the interruption could cause us to lose customers. It is also possible that a third party acquirer of
16
such technology could offer the AI models and technologies to the public as a free add-on capability, in which case certain of our customers would have less incentive to pay us for the use of our platform. If a key third party technology becomes unavailable to us or is impractical for us to continue to use, the functionality of our platform could be interrupted, and our expenses could increase as we search for an alternative technology. As a result, our business, results of operations and financial condition could be adversely affected through the loss of customers and/or from increased operating costs.
We rely on third parties to develop AI models for our platform and in some cases to integrate them with our platform.
A key element of our aiWARE platform is the ability to incorporate and integrate AI models developed by multiple third-party vendors, and we plan to continue to increase the number of third-party AI models incorporated into our aiWARE platform in order to enhance the performance and power of our platform. As we work to add new AI models to our platform, we may encounter difficulties in identifying additional high-quality AI models (particularly high performing, specialized models), entering into agreements for their inclusion in our ecosystem on acceptable terms or at all and/or in coordinating and integrating their technologies into our system. We may incur additional costs to modify and adjust existing functionalities of our platform to accommodate multiple classes of AI models, without the assurance that such costs can be recouped by the additional revenues generated by the new capabilities. As aiWARE becomes more complex and as we release enhancements to our platform that require changes to AI models, we may not be able to integrate third-party AI models in a seamless or timely manner due to a number of factors, including incompatible software, lack of cooperation from developers, insufficient internal technical resources, platform security constraints, and the inability to secure the necessary licenses or legal authorizations required. In addition, we have established a self-service development environment in which such third party developers integrate their AI models onto our platform, and we will be dependent in part upon their ability to do so effectively and quickly. We may not have full control over the quality and performance of third-party providers, and therefore, any unexpected deficiencies or problems arising from these third-party providers may cause significant interruptions in the operation of our platform. The failure of third party developers to integrate their AI models seamlessly into our platform and/or provide reliable, scalable services may impact the reliability of our platform and harm our reputation and business, results of operations and financial condition.
If we are not able to develop a strong brand for our aiWARE platform and other products and increase market awareness of our company, platform and other products, then our business, results of operations and financial condition may be adversely affected.
We believe that the success of our platform will depend in part on our ability to develop a strong brand identity for our “Veritone”, “aiWARE” and other service marks, and to increase the market awareness of our platform and its capabilities. We are still in the early development stage of our business and, as such, our brand is not yet well established. The successful promotion of our brand will depend largely on our continued marketing efforts and our ability to ensure that our technology provides the expected benefits to our customers. We also believe that it is important for us to be thought leaders in the AI-based cognitive computing market. Our brand promotion and thought leadership activities may not be successful or produce increased revenue. In addition, independent industry analysts often provide reviews of our platform and of competing products and services, which may significantly influence the perception of our aiWARE platform in the marketplace. If these reviews are negative or not as positive as reviews of our competitors’ products and services, then our brand may be harmed.
The promotion of our brand also requires us to make substantial expenditures, and we anticipate that these expenditures will increase as our industry becomes more competitive and as we seek to expand into new markets. These higher expenditures may not result in any increased revenue or in revenue that is sufficient to offset the higher expense levels. If we do not successfully maintain and enhance our brand, then our business may not grow, we may see our pricing power reduced relative to competitors and we may lose customers, all of which would adversely affect our business, results of operations and financial condition.
Interruptions or performance problems associated with our technology and infrastructure, or that of our third party service providers, including AWS and Azure, may adversely affect our business and operating results.
Our business success depends in part on the ability of customers to access our Software Products & Services and Managed Services at any time and within an acceptable amount of time. We have experienced, and may in the future experience, disruptions, outages and other performance problems due to a variety of factors, including infrastructure changes, introductions of new applications and functionality, software errors and defects, capacity constraints due to an increasing number of users accessing our platform or initiating large volumes of processing simultaneously, or security related incidents. In addition, we rely on third parties, including AWS and Azure, to operate critical business systems and process sensitive information in a variety of contexts, including for hosting, storage and other critical services, required to operate our
17
Software Products & Services and Managed Services. Our ability to monitor these third parties’ information security practices is limited, and these third parties may not have adequate information security measures in place. As such, we are vulnerable to service interruptions, delays and outages experienced or caused by these third parties, and we may experience adverse consequences in the event these third party service providers experience a service interruption, delay or outage. Because we also incorporate diverse software and hosted services from many third-party vendors, we may encounter difficulties and delays in integrating and synthesizing these applications and programs, which may cause downtimes or other performance problems. It may become increasingly difficult to maintain and improve the performance of our platform, especially during peak usage times and as our platform becomes more complex or usage increases.
Certain of our customer contracts include service level obligations, including system uptime commitments and/or required response times in the case of technical issues. If our Software Products & Services and Managed Services are unavailable or if our users are unable to access them within a reasonable amount of time or at all, we may be in breach of our contractual obligations, we may be required to issue credits or refunds to customers, and/or our customers may be entitled to terminate their contracts with us.
AWS and Azure provide us with hosting, computing and storage services pursuant to agreements that may be canceled under certain circumstances. If any of our agreements with AWS or Azure is terminated, we could experience interruptions on our platform and in our ability to make our platform available to customers, as well as delays and additional expenses in arranging alternative cloud infrastructure services.
Any of the above circumstances or events may harm our reputation, cause customers to stop using our platform, impair our ability to increase revenue from existing customers, impair our ability to grow our customer base, subject us to financial penalties and liabilities under our service level agreements and otherwise harm our business, results of operations and financial condition.
The security of our platform, networks, computer systems or data may be breached, and any such breach will have an adverse effect on our business and reputation.
In the ordinary course of business, we process proprietary, confidential, and sensitive data, including personal data, intellectual property, trade secrets and our customers’ data (collectively, sensitive information). Certain data privacy and security obligations may require us to implement and maintain specific security measures or industry-standard or reasonable security measures to protect our information technology systems and sensitive information. In particular, the data processed and stored in our platform, networks, and computer systems by customers in the government market may contain highly sensitive data that is subject to protection under government regulations, and we are obligated to comply with stringent requirements related to the security of such data, such as FedRAMP and Criminal Justice Information Services (“CJIS”) security requirements.
Individuals or entities may attempt to penetrate our network, computer system or platform security, or that of our third-party hosting and storage providers, and could gain access to our sensitive data, including customer data. Some actors now engage and are expected to continue to engage in cyber-attacks, including without limitation nation-state actors for geopolitical reasons and in conjunction with military conflicts and defense activities. During times of war and other major conflicts, we, the third parties upon which we rely, and our customers may be vulnerable to a heightened risk of these attacks, including retaliatory cyber-attacks, that could materially disrupt our systems and operations, supply chain, and ability to produce, sell and distribute our services.
In addition, our network, computer system or platform may be subject to a variety of evolving threats, computer malware, viruses and computer hacking, fraudulent use attempts and phishing attacks, all of which have become more prevalent in our industry. In particular, severe ransomware attacks are becoming increasingly prevalent and can lead to significant interruptions in our operations, loss of sensitive data and income, reputational harm, and diversion of funds. Extortion payments may alleviate the negative impact of a ransomware attack, but we may be unwilling or unable to make such payments due to, for example, applicable laws or regulations prohibiting such payments.
Remote work has become more common and has increased risks to our platform, network, computer systems, and data, as more of our employees utilize network connections, computers and devices outside our premises or network, including working at home, while in transit and in public locations. Additionally, future or past business transactions (such as acquisitions or integrations) could expose us to additional cybersecurity risks and vulnerabilities, as our platform, network, or computer systems could be negatively affected by vulnerabilities present in acquired or integrated entities’ systems and
18
technologies. Furthermore, we may discover security issues that were not found during due diligence, and it may be difficult to integrate companies into our information technology environment and security program.
These malicious activities could result in the unauthorized, unlawful, or accidental acquisition, modification, destruction, loss, alteration, encryption, disclosure, access or misappropriation of our proprietary or confidential information, including of our customers and their employees or third parties, and/or damage to our or our third party service providers’ platform, network, or computer systems. If any of our customers’ data is accessed, disclosed, modified or destroyed without authorization, it could harm our reputation, those customers or other customers could terminate their agreements with us, or we could be exposed to civil and criminal liability, penalties and fines
While we have implemented procedures and safeguards that are designed to prevent security breaches and cyber-attacks, they may not be able to protect against all attempts to breach our platform, network, computer systems, or data, and we may not become aware in a timely manner of any such security breach. We take steps to detect and remediate vulnerabilities, but we may not be able to detect and remediate all vulnerabilities because the threats and techniques used to exploit the vulnerability change frequently and are often sophisticated in nature. Therefore, such vulnerabilities could be exploited but may not be detected until after a security incident has occurred. These vulnerabilities pose material risks to our business. Further, we may experience delays in developing and deploying remedial measures designed to address any such identified vulnerabilities.
Applicable data privacy and security obligations may require us to notify relevant stakeholders of security incidents. Such disclosures are costly, and the disclosure or the failure to comply with such requirements could lead to adverse consequences. A security breach of our platform, network or computer systems, or those of our technology service providers or third party vendors, could result in the loss of business, reputational damage, regulatory investigations and orders, litigation, indemnity obligations, damages for contract breach, civil and criminal penalties for violation of applicable laws, regulations or contractual obligations, and significant costs, fees and other monetary payments for remediation. If we fail to maintain reliability, security and availability of our platform, network, or computer systems, or if customers believe that our platform does not provide adequate security for the storage of sensitive information or its transmission over the Internet, we may lose existing customers and we may not be able to attract new customers. If we experience security breaches or cyber-attacks or fail to comply with security requirements related to our secure government cloud environment, we may lose our ability to obtain or maintain a FedRAMP certification, which could result in the loss of business from customers in the government market. Any of the foregoing could have a material adverse effect on our business, results of operations and financial position and negatively impact our ability to grow and operate our business.
In addition to experiencing a security breach, third parties may gather, collect, or infer sensitive information about us from public sources, data brokers, or other means that reveals competitively sensitive details about our organization and could be used to undermine our competitive advantage or market position.
Risks Related to Target Markets, Competition and Customers
The success of our business depends on our ability to expand into new vertical markets and attract new customers in a cost-effective manner.
To grow our business, we plan to drive greater awareness and adoption of our aiWARE platform, applications and services from enterprises across new vertical markets, including the Government & Regulated Industries markets. We intend to continue to invest in sales and marketing, as well as in technological development, to meet evolving customer needs in these and other markets. We may not be successful in gaining new customers in any or all of these markets. Some markets may present unique and unexpected challenges and difficulties. For example, for us to offer our Software Products & Services to certain government customers, we are required to operate our aiWARE platform in a secure government cloud environment, and in some cases, in a private cloud environment or an on-premises environment, in order to meet these customers’ requirements and to enable them to maintain compliance with applicable regulations that govern the use, storage and transfer of certain government data. However, due to the secure nature of these environments, at this time, not all of the functionalities, features and cognitive processing capabilities of our aiWARE platform are available in these environments, which may limit or reduce the performance of our services. Furthermore, we may incur additional costs to modify our current platform to conform to customers’ or cloud providers’ requirements, and we may not be able to generate sufficient revenue to offset these costs. We are also required to comply with certain regulations required by government customers, such as FedRAMP and CJIS, which require us to incur significant costs, devote management time and modify our current platform
19
and operations. If we are unable to comply with those regulations effectively and in a cost-effective manner, our financial results could be adversely affected.
As part of our strategy to penetrate new vertical markets, we will incur marketing expenses before we are able to recognize any revenue in such markets, and these expenses may not result in increased revenue or brand awareness. We have made in the past, and may make in the future, significant expenditures and investments in new marketing campaigns, and these investments may not lead to the cost-effective acquisition of additional customers. If we are unable to maintain effective marketing programs, then our ability to attract new customers or enter new vertical markets could be adversely affected.
We generate substantial revenue from a single customer and the loss of such customer may harm our business, results of operations and financial results.
We generate substantial revenue from a single customer, Amazon, for which there is no long-term contract with us. Given Amazon’s high concentration of revenue on our consolidated results, our revenue results may fluctuate significantly year over year based upon their hiring patterns. For example, during the third and fourth quarters of fiscal year 2022, we experienced a slowdown in our Average Annual Revenue (AAR) per customer which was almost entirely driven by a reduction in hiring consumption from Amazon. In the event Amazon decides to terminate its contract with us, suffers downturns in its business leading to a further reduction in its budget for our hiring solutions, or decides to develop a competing solution or otherwise take its recruitment and hiring needs in-house, and we are unable to obtain additional customers or increase our revenue from existing customers to offset the reduction of these revenues, we could experience a material adverse effect on our business, financial condition and reported revenue and results of operation.
Technological advances may significantly disrupt the labor market and weaken demand for human capital at a rapid rate.
The success of our hiring solutions are dependent on our customers’ demands for talent. As technology continues to evolve, more tasks currently performed by people may be replaced by automation, robotics, machine learning, artificial intelligence and other technological advances outside of our control. This trend poses a risk to the talent acquisition industry as a whole, particularly in lower-skill job categories that may be more susceptible to such replacement.
Significant segments of the market for talent acquisition software and services may have hiring needs and service preferences that are subject to greater volatility than the overall economy.
The target customer segment for our hiring solutions span a wide range of company characteristics, including company size, geography, and industry, among other factors. Hiring activity may vary significantly among businesses with different characteristics and accordingly, any concentration we may have among businesses with certain characteristics may subject us to high volatility in our financial results. Smaller businesses, for example, typically have less persistent hiring needs and may experience greater volatility in their need for talent acquisition software and services and preferences among providers of such services. Along with a relatively short sales cycle, smaller businesses may be more likely to change platforms based on short-term differences in perceived price, value, service level, or other factors. Difficulty in acquiring and/or retaining these businesses as customers may adversely affect our operating results.
We currently generate significant revenue from a limited number of key customers and the loss of one or more of those customers or a significant reduction in the revenues generated from those customers may harm our business, results of operations and financial results.
Our ten largest customers by revenue accounted for approximately 55%, 57% and 34% of our net revenues in fiscal years 2022, 2021 and 2020, respectively. One customer accounted for approximately 25% of net revenues in fiscal year 2022 and 30% in 2021, after not generating significant revenues in fiscal year 2020.
Ten customers accounted for approximately 76% of our total Software Products & Services revenues in 2022, with one customer accounting for approximately 58% of our total Software Products & Services revenues. Ten customers accounted for approximately 38% of our total Managed Services revenues in 2022, with one customer accounting for approximately 11% of our total Managed Services revenues.
If any of our key customers, particularly our key advertising customers which have the ability to terminate our agreements on short notice, decides to terminate or not to renew its contract with us, renews on less favorable terms, or
20
suffers downturns in its business leading to a reduction in its marketing spending, and we are not able to gain additional customers or increase our revenue from other customers to offset the reduction of revenues, our business, results of operations and financial condition would be harmed.
Our sales efforts related to our Software Products & Services involve considerable time and expense and our sales cycle is often long and unpredictable.
Our results of operations may fluctuate, in part, because of the length and unpredictability of our sales cycle, particularly in our Government & Regulated Industries markets. As part of our sales efforts, we invest considerable time and expense evaluating the specific organizational needs of our potential customers and educating these potential customers about the technical capabilities and value of our Software Products & Services. Potential customers often require evaluation licenses at no charge or for nominal fees to evaluate our solutions before making a purchase decision. Sales to government customers may also be subject to lengthy and complex procurement processes, including technology and security assessments, budget approvals and competitive bidding requirements. Due to these factors, our sales cycle often lasts several months or more for some customers. Our sales efforts typically require a significant investment of human resources expense and time, including efforts by sales engineers, solution architects, product development and senior management, and we may not be successful in making a sale to a potential customer. If our sales efforts to a potential customer do not result in sufficient revenue to justify our investments, our business, financial condition, and results of operations could be adversely affected.
Advertising customers periodically review and change their advertising requirements and relationships. If we are unable to remain competitive or retain key customers, our business, results of operations and financial position may be adversely affected.
The media placement industry is highly competitive, and certain advertising customers periodically put their advertising and marketing business up for competitive review. Customers also review the cost and benefit of servicing all or a portion of their advertising and marketing needs in-house. We have won and lost accounts in the past as a result of these reviews. Because our advertising contracts generally can be canceled by our customers upon 30 to 90 days’ prior written notice, clients can easily change media providers on short notice without any penalty. In addition, from time to time, customers cancel media campaigns for their internal business reasons. If we are not able to retain key customers, or if any of our key customers significantly reduce their advertising spend, our revenue may be adversely affected, which could have a material and adverse effect on our business, results of operations and financial position.
Acquiring and retaining advertising customers depends on our ability to avoid and manage conflicts of interest arising from other customer relationships and attracting and retaining key personnel.
Our ability to acquire new advertising customers and to retain existing customers may, in some cases, be limited by customers’ perceptions of, or policies concerning, conflicts of interest arising from other customer relationships. If we are unable to manage these customer relationships and avoid potential conflicts of interest, our business, results of operations and financial position may be adversely affected.
Our ability to acquire new advertising customers and to retain existing customers is dependent in large part upon our ability to attract and retain our key personnel in that business, who are an important aspect of our competitiveness. If we are unable to attract and retain key personnel, our ability to provide our services in the manner customers have come to expect may be adversely affected, which could harm our reputation and result in a loss of customers, which could have a material adverse effect on our business, results of operations and financial position.
Risks Related to Intellectual Property
We face risks arising from our digital content licensing services, including potential liability resulting from claims by third parties for infringement or violation of copyrights, publicity or other rights, as well as indemnification claims by rights holders and customers.
We manage and license digital content on behalf of leading rights holders in the film, television, sports and advertising industries. We enter into agreements with rights holders under which they grant us the right to distribute and license their content to third parties, subject to certain restrictions and requirements, such as limitations on the type and/or duration of use and requirements to obtain clearances and consents from third parties related to the content. Under these agreements, the rights holders generally represent and warrant that they have the right to license the content to us and that the authorized use
21
of the content will not infringe any third party copyrights and agree to indemnify us for claims arising from breach of such representations and warranties. However, we, and/or our customers to which we sublicense the content, are generally responsible for obtaining all required clearances, permissions and consents with respect to any specific person, place, property or subject matter depicted in the content, each of which may be subject to trademarks, rights of publicity, property rights or other rights belonging to third parties, and we generally agree to indemnify the right holders with respect to claims arising from any failure to do so. In many cases, our agreements with rights holders also require that we include specific terms, conditions, covenants and obligations in our agreements with our customers.
In our license agreements with customers, we represent and warrant that we have the right to sublicense the content to them and that their authorized use of the content will not infringe any third party copyrights, and we agree to indemnify our customers for claims arising from breach of such representations and warranties. However, our customers are generally responsible for obtaining all necessary clearances, permissions and consents from third parties, unless we have expressly agreed to provide clearance services with respect to the content, and our customers generally agree to indemnify us for claims arising from their failure to do so. If we or our customers fail to obtain all clearances, permissions and consents from third parties required for the customers’ use of licensed content, or if our customers otherwise use content in a manner not authorized by the terms of our agreements with the rights holders, then third parties may bring claims against us and the rights holders, and the rights holders may seek indemnification from us related to such claims. In some cases, we may not be entitled to a supporting indemnification by our customers, or we may not be successful in enforcing our rights to indemnification by our customers. In addition, third parties may bring claims against us and our customers for copyright infringement, and we may be required to indemnify our customers for such claims. Similarly, we may not be entitled to indemnification by the rights holders, or we may not be able to enforce our rights to indemnification by the rights holders.
We may incur significant liabilities and costs in the event of claims for infringement or violation of copyrights, publicity or other rights, and/or indemnification claims by third-party rights holders and customers. Regardless of their merit and outcome, intellectual property and indemnification claims are time consuming, expensive to litigate or settle and cause significant diversion of management attention and could severely harm our financial condition and reputation, and adversely affect our business.
We maintain insurance policies to cover potential intellectual property disputes. However, if an intellectual property claim or related indemnification claim, or a series of claims, is brought against us in excess of our insurance coverage or for uninsured liabilities, our business could suffer. In addition, we may not be able to maintain insurance coverage at a reasonable cost or in sufficient amounts or scope to protect us against all losses.
We may be sued by third parties for alleged infringement of their proprietary rights, which could adversely affect our business, results of operations and financial condition.
There has been considerable patent and other intellectual property development activity in the AI industry, which has resulted in litigation based on allegations of infringement or other violations of intellectual property rights. Our future success depends, in part, on not infringing the intellectual property rights of others. In the future, we may receive claims from third parties, including our competitors, alleging that our platform and underlying technology infringe or violate such third party’s intellectual property rights, and we may be found to be infringing upon such rights. We may be unaware of the intellectual property rights of others that may cover some or all of our technology. In addition, in operating our platform, we rely significantly on software provided by third parties, including AI models and applications, and we may become subject to similar infringement claims related to such third party software. We may not have adequate indemnities from, or we may not be successful in enforcing our rights to indemnification by, such third party software providers.
Any such claims or litigation could cause us to incur significant expenses and, if successfully asserted against us, could require that we pay substantial damages or ongoing royalty payments, prevent us from offering some portion of our platform, or require that we comply with other unfavorable terms. We may also be obligated to indemnify our customers or business partners in connection with any such litigation and to obtain licenses or modify our platform, which could further exhaust our resources. Patent infringement, trademark infringement, trade secret misappropriation and other intellectual property claims and proceedings brought against us, whether successful or not, could harm our brand, business, results of operations and financial condition. Litigation is inherently uncertain, and any judgment or injunctive relief entered against us or any adverse settlement could negatively affect our business, results of operations and financial condition. In addition, litigation can involve significant management time and attention and be expensive, regardless of the outcome.
We could incur substantial costs in protecting or defending our intellectual property rights, and any failure to protect our intellectual property could adversely affect our business, results of operations and financial condition.
22
Our success depends, in part, on our ability to protect our brand and the proprietary methods and technologies that we develop under patent and other intellectual property laws of the United States and foreign jurisdictions so that we can prevent others from using our inventions and proprietary information. As of March 10, 2023, in the United States, we have 41 issued patents, which expire between 2030 and 2042, and have 12 patent applications pending for examination. As of such date, we also had 13 issued patents and 41 patent applications pending for examination in foreign jurisdictions (including international PCT applications), all of which are based on counterpart U.S. patent applications pursued by us. We may not be issued any additional patents and any patents that have been issued or that may be issued in the future may not provide significant protection for our intellectual property. In addition, we have registered, or have applied for registration of, numerous trademarks, including Veritone and aiWARE, in the United States and in several foreign jurisdictions. If we fail to protect our intellectual property rights adequately, our competitors might gain access to our technology and our business, results of operations and financial condition may be adversely affected.
The particular forms of intellectual property protection that we seek, or our business decisions about when to file patent applications and trademark applications, may not be adequate to protect our business. We could be required to spend significant resources to monitor and protect our intellectual property rights. Litigation may be necessary in the future to enforce our intellectual property rights, determine the validity and scope of our proprietary rights or those of others, or defend against claims of infringement or invalidity. Such litigation could be costly, time-consuming and distracting to management, result in a diversion of significant resources, lead to the narrowing or invalidation of portions of our intellectual property and have an adverse effect on our business, results of operations and financial condition.
We also rely, in part, on confidentiality agreements with our business partners, employees, consultants, advisors, customers and others in our efforts to protect our proprietary technology, processes and methods. These agreements may not effectively prevent disclosure of our confidential information, and it may be possible for unauthorized parties to copy our software or other proprietary technology or information, or to develop similar software independently without our having an adequate remedy for unauthorized use or disclosure of our confidential information. In addition, others may independently discover our trade secrets and proprietary information, and in these cases, we would not be able to assert any trade secret rights against those parties. Costly and time-consuming litigation could be necessary to enforce and determine the scope of our proprietary rights, and the failure to obtain or maintain trade secret protection could adversely affect our competitive business position.
In addition, the laws of some countries do not protect intellectual property and other proprietary rights to the same extent as the laws of the United States. To the extent we expand our international activities, our exposure to unauthorized copying, transfer and use of our proprietary technology or information may increase.
Our means of protecting our intellectual property and proprietary rights may not be adequate or our competitors could independently develop similar technology. If we fail to meaningfully protect our intellectual property and proprietary rights, our business, results of operations and financial condition could be adversely affected.
Our use of open source software could negatively affect our ability to sell our products and subject us to possible litigation.
Our aiWARE platform incorporates select open source software, and we expect to continue to incorporate open source software in our aiWARE platform in the future. Few of the licenses applicable to open source software have been interpreted by courts, and there is a risk that these licenses could be construed in a manner that could impose unanticipated conditions or restrictions on our ability to commercialize our products and platform. Moreover, although we have implemented policies to regulate the use and incorporation of open source software into our aiWARE platform, we cannot be certain that we have not incorporated open source software in our aiWARE platform in a manner that is inconsistent with such policies. If we fail to comply with open source licenses, we may be subject to certain requirements, including requirements that we offer our products that incorporate the open source software for no cost, that we make available source code for modifications or derivative works we create based upon, incorporating or using the open source software and that we license such modifications or derivative works under the terms of applicable open source licenses. If an author or other third party that distributes such open source software were to allege that we had not complied with the conditions of one or more of these licenses, we could be required to incur significant legal expenses defending against such allegations and could be subject to significant damages, enjoined from generating revenue from customers using products that contained the open source software and required to comply with onerous conditions or restrictions on these products. In any of these events, we and our customers could be required to seek licenses from third parties in order to continue offering our Software Products & Services and to re-engineer or discontinue offering our products to customers in the event re-engineering cannot be accomplished on a timely basis. Any of the foregoing could require us to devote additional research and development
23
resources to re-engineer our products, could result in customer dissatisfaction and may adversely affect our business, results of operations and financial condition.
Risks Related to Regulatory Compliance
Data protection and privacy laws and regulations could require us to make changes to our business, impose additional costs on us and reduce the demand for our software products and solutions.
Our customers utilize our Software Products & Services and Managed Services to process, analyze and store data, which may contain personal information that is subject to data protection and privacy laws in various jurisdictions. Federal, state, local and foreign government bodies and agencies have adopted, or may in the future adopt, laws, regulations and guidance regarding the collection, use, processing, storage and disclosure of personal information, such as the GDPR, the CPRA and similar regulations and guidance adopted in other jurisdictions, including other states within the United States. In addition to government laws, regulations and guidance, privacy advocates and industry groups may propose various self-regulatory standards that may legally or contractually apply to our business. We may also be subject to other data protection and privacy obligations, such as external and internal privacy and security policies, other public representations and contractual requirements.
The regulatory framework relating to privacy and data protection issues worldwide is evolving rapidly and is likely to remain uncertain for the foreseeable future. Because the interpretation and application of many privacy and data protection obligations are uncertain, it is possible that these obligations may be interpreted and applied in a manner inconsistent with our existing privacy and data management practices.
As we expand into new jurisdictions or markets, we will be required to understand and comply with various new requirements applicable in those jurisdictions or markets. For example, we have entered into agreements and are actively pursuing opportunities to provide our Software Products & Services and Managed Services to customers in Europe, which involve processing of personal data. Europe and other jurisdictions have enacted or proposed laws with stringent obligations and significant penalties. For example, the GDPR imposes financial penalties for non-compliance, which can be up to four percent of global revenue or 20 million Euros, whichever is greater.
In the United States, federal, state, and local governments have enacted numerous data privacy and security laws, including data breach notification laws, personal data privacy laws, consumer protection laws (e.g., Section 5 of the Federal Trade Commission Act), and other similar laws (e.g., wiretapping laws). For example, we are also required to comply with the CCPA, the CPRA and the regulations implemented thereunder, with respect to personal information of California consumers that we collect and process, both directly and indirectly as a service provider to our customers. Other states, such as Virginia and Colorado, have also passed comprehensive privacy laws, and similar laws are being considered in several other states, as well as at the federal and local levels. Moreover, under various privacy laws and other obligations, we may be required to obtain certain consents to process personal data. Our inability or failure to do so could result in adverse consequences.
Under the GDPR and/or the CPRA, as well as similar data protection regulations implemented in other jurisdictions, we are required to maintain appropriate technical and organizational measures to ensure the security and protection of personal data and information, and we must comply (either directly or indirectly in support of our customers’ compliance efforts, as provided for in our contracts with customers) with a number of requirements with respect to individuals whose personal data or information we collect and process, including, among others, notification requirements and requirements to comply with requests from individuals to (i) opt out of collection, processing and/or sale of their data or information, (ii) delete their data or information, and (iii) receive copies of and other information regarding our collection and processing of their data or information.
We are also bound by contractual obligations related to data privacy and security, and our efforts to comply with such obligations may not be successful. For example, certain privacy laws, such as the GDPR and the CCPA, require our customers to impose specific contractual restrictions on their service providers. Additionally, some of our customer contracts require us to host personal data locally. We also publish privacy policies, marketing materials and other statements, such as compliance with certain certifications or self-regulatory principles, regarding data privacy and security. If these policies, materials or statements are found to be deficient, lacking in transparency, deceptive, unfair, or misrepresentative of our practices, we may be subject to investigation, enforcement actions by regulators or other adverse consequences.
24
To the extent applicable to our business or the businesses of our customers, these obligations could have negative effects on our business, including by increasing our costs and operating expenses, and delaying or impeding our deployment of new core functionality and products. Compliance with these obligations requires significant management time and attention, and failure to comply could result in government enforcement actions (e.g., investigations, inspections, etc.), negative publicity, litigation (including class action claims), subject us to contractual liability, fines or penalties, additional reporting requirements and/or oversight or result in demands that we modify or cease existing business practices (including bans on processing personal data or orders to destroy personal data). In addition, the costs of compliance with, and other burdens imposed by, such laws, regulations and industry standards may adversely affect our customers’ ability or desire to collect, use, process and store personal information using our software solutions, which could reduce overall demand for them. Even the perception of privacy and data security concerns, whether or not valid, may inhibit market acceptance of our software solutions in certain markets. Furthermore, privacy and data security concerns may cause our customers’ customers, vendors, employees and other industry participants to resist providing the personal information necessary to allow our customers to use our products and services effectively. Any of these outcomes could adversely affect our business and operating results.
Finally, governments and regulators in certain jurisdictions, including Europe, are increasingly seeking to regulate the use, transfer and other processing of non-personal information (for example, under the European Union’s Data Act), an area which has typically been the subject of very limited or no specific regulation. This means that, if and to the extent such regulations are relevant to our operations or those of our customers, certain of the risks and considerations outlined herein may apply equally to our processing of both personal and non-personal information.
Tax authorities in the United States and in foreign jurisdictions may successfully assert that we, including our acquired companies, should have collected, or in the future should collect, sales, use, value added, or similar taxes, and we could be subject to substantial liabilities with respect to past or future transactions, which could adversely affect our results of operations.
We conduct operations in multiple tax jurisdictions throughout the United States. In many of these jurisdictions, non-income-based taxes, such as sales and use taxes, are assessed on our operations. Our customers agree to pay the use taxes in the states and other jurisdictions where our services are subject to sales or use tax. As a result, we have not billed or collected these taxes and, in accordance with generally accepted accounting principles in the United States, we have not recorded a provision for our tax exposure in these jurisdictions. In the event these jurisdictions challenge our approach or our customers do not satisfy the sales or use tax obligation, such jurisdictions may assert tax assessments, penalties and/or interest against us, which could adversely affect our business, results of operations and financial condition.
In addition, we conduct operations outside of the United States, including in Israel and parts of Europe. These foreign jurisdictions have complex tax laws and regulations, and we may be subject to future uncertainties as a result of historical tax positions taken by us or our acquired companies. While we believe we have taken proper tax positions, as reflected in our financial statements herein, foreign tax authorities may challenge certain tax positions we or our acquired companies have taken historically, or may take in the future. For example, Veritone, Inc. acquired PandoLogic, Inc., the United States subsidiary of PandoLogic Ltd., in 2022, and as a result, created certain tax liabilities within Israel associated with the deemed tax attributes of this transaction. While we believe we have properly accrued for estimated tax obligations due to Israel and the United States, we cannot be certain the Israeli or the U.S. tax authorities will agree with our calculated tax impact. As a result, our tax positions may be challenged in the future, and subject to local-, state- and country-specific audits and inquiries, the outcomes of which could differ materially from our estimates. Incurring any such tax liabilities (including related penalties and interest) could materially adversely affect our business and financial condition.
We currently benefit from certain tax incentives extended by the government of Israel that are designed to encourage investment and development of technology in Israel but which require recipients to meet certain conditions, including development milestones and other requirements. If we fail to satisfy such requirements, we may lose certain tax incentives, resulting in additional income tax expenses.
Recent and proposed laws regarding the use of facial recognition technology, the processing of biometric data, and the use of AI, automated decision-making and machine learning technologies could have a material adverse effect on demand for certain of our products.
Certain of our Software Products & Services, particularly our IDentify face matching application for law enforcement agencies, utilize facial recognition technology. Facial recognition technology has been the subject of increasing concern and criticism, including over the potential for the technology to misidentify individuals as criminal suspects, and to be used in
25
ways that infringe on individual rights. Numerous legislative proposals have been introduced to ban or restrict the use of the technology by certain governmental agencies, and several U.S. cities, including San Francisco, California, Oakland, California and Somerville, Massachusetts, have enacted such bans. Although some jurisdictions are re-evaluating the breadth of such bans, where any ban or restriction on the use of facial recognition technologies by governmental agencies have been or may be enacted, potential government customers for our IDentify solution may be prohibited from or restricted in using the technology. If such bans or restrictions are enacted in a significant number of jurisdictions, it would have a material adverse effect on the market for software solutions that utilize facial recognition technology, including our IDentify solution.
We also offer facial recognition technologies to non-governmental customers. Data privacy laws have been enacted or introduced in a number of jurisdictions that regulate the processing of biometric data, including facial images in facial recognition systems, by non-governmental actors. For example, the Illinois Biometric Information Privacy Act (“BIPA”) regulates the collection, use, safeguarding, and storage of biometric information. BIPA provides for substantial penalties and statutory damages and have generated significant class action activity; the cost of litigating and settling any claims that we have violated the BIPA or similar laws could be significant. As another example, certain comprehensive U.S. state privacy laws, such as Virginia’s Consumer Data Protection Act, require covered businesses to obtain affirmative consumer consent before processing biometric data and other sensitive data. Additionally, under the GDPR, use of biometric data for the purpose of uniquely identifying a natural person constitutes the processing of a special category of personal data, to which heightened standards, requirements and regulatory and individual scrutiny apply. The processing of biometric data for such purposes is prohibited unless one of a very limited and specific set of conditions is satisfied (such as explicit consent of the data subject). Effective compliance in this area (including in the context of use of certain of our products) can be highly challenging, and we are reliant on our customers to ensure that such a condition is satisfied when they use our products to identify someone. Provision of such technologies in compliance with the GDPR is highly challenging and may mean we are unable to provide certain of our products in certain jurisdictions. Such laws may limit the demand for our aiWARE platform for non-governmental use cases that utilize facial recognition technology, which could adversely impact our ability to grow our business in those areas.
In addition, AI, automated decision making, and machine learning technologies are increasingly subject to regulatory scrutiny for their potentially discriminatory effects. For example, in Europe, there is a proposed regulation related to AI that, if adopted, could impose onerous obligations related to the use of AI-related systems. The proposed Regulation on Artificial Intelligence designates certain AI technologies as high risk and subject to numerous onerous compliance obligations; the regulation also imposes a prohibition of the use of ‘real-time’ biometric identification systems in publicly accessible spaces by law enforcement authorities or on their behalf unless very limited exceptions apply. Additionally, several U.S. jurisdictions have enacted measures related to the use of AI in products and service. For example, New York City passed a law to regulate the use of automated employment decision tools by employers and employment agencies. Certain of these laws are likely to be materially unfavorable to our interests and/or inconsistent with our existing operations, policies, practices or plans (or may be interpreted as such).
Given that AI, automated decision making and machine learning technologies are core to our business, any increased regulation over these technologies could significantly complicate compliance efforts, increase legal risk and compliance costs for us, the third parties upon whom we rely, and our customers, increase our cost of doing business, impede or prevent our growth plans (including into Europe), require us to change our business operations at significant cost, and, in turn, reduce demand for our products.
Risks Related to the Ownership of Our Securities and Our Public Company Operations
Our common stock price has been extremely volatile and could continue to fluctuate widely in price, which could result in substantial losses for investors.
The market price of our common stock has been, and we expect will continue to be, subject to extreme fluctuations over short periods of time. For example, the closing price of our common stock has ranged from a low of $4.85 to a high of $19.77 during the 12-month period ended February 28, 2023. Prior to that, from the completion of our initial public offering (“IPO”) on May 12, 2017 through February 28, 2022, the closing price of our common stock has ranged from a low of $1.52 to a high of $65.91. These fluctuations may be due to various factors, many of which are beyond our control, including:
26
In recent years, the stock markets generally have experienced extreme price and volume fluctuations that have often been unrelated or disproportionate to the operating performance of the listed companies. Broad market and industry factors may significantly affect the market price of our common stock, regardless of our actual operating performance. These fluctuations have been, and may continue to be, even more pronounced in the trading market for our common stock.
Further, on some occasions, our stock price may be, or may be purported to be, subject to “short squeeze” activity. A “short squeeze” is a technical market condition that occurs when the price of a stock increases substantially, forcing market participants who had taken a position that its price would fall (i.e., who had sold the stock “short”), to buy it, which in turn may create significant, short-term demand for the stock not for fundamental reasons, but rather due to the need for such market participants to acquire the stock in order to forestall the risk of even greater losses. A “short squeeze” condition in the market for a stock can lead to short-term conditions involving very high volatility and trading that may or may not track fundamental valuation models.
In addition, in the past, class action litigation has often been instituted against companies whose securities have experienced periods of volatility in market price. Securities litigation brought against us following volatility in our stock price, regardless of the merit or ultimate results of such litigation, could result in substantial costs, which would hurt our financial condition and operating results and divert management’s attention and resources from our business.
If we fail to maintain an effective system of disclosure controls and internal control over financial reporting, our ability to produce timely and accurate financial statements or comply with applicable regulations could be impaired.
As a public company, we are required to comply with the Sarbanes-Oxley Act and related rules implemented by the SEC. The Sarbanes-Oxley Act requires, among other things, that we maintain effective internal control over financial reporting and disclosure controls and procedures. In particular, we must perform system and process evaluation and testing of our internal control over financial reporting to allow management to report on the effectiveness of our internal control over financial reporting, as required by Section 404 of the Sarbanes-Oxley Act. This report must contain, among other things, an assessment of the effectiveness of our internal control over financial reporting as of the end of our fiscal year, including a statement as to whether or not our internal control over financial reporting is effective. This assessment must include disclosure of any material weaknesses in our internal control over financial reporting identified by management. In addition, because we ceased to be an emerging growth company as of December 31, 2022, we are required to have our independent registered public accounting firm attest to the effectiveness of our internal control over financial reporting in this annual report on Form 10-K.
Our current controls and any new controls that we develop may become inadequate because of changes in conditions in our business. Further, weaknesses in our disclosure controls and internal control over financial reporting may be discovered in the future. Any failure to develop or maintain effective controls or any difficulties encountered in their implementation or improvement could harm our results of operations or cause us to fail to meet our reporting obligations and may result in a restatement of our financial statements for prior periods. Any failure to implement and maintain effective internal control over financial reporting also could adversely affect the results of periodic management evaluations and annual independent registered public accounting firm attestation reports regarding the effectiveness of our internal control over financial reporting. Ineffective disclosure controls and procedures and internal control over financial reporting could also cause investors to lose confidence in our reported financial and other information and could have a material and adverse effect on our business, results of operations and financial condition and could cause a decline in the trading price of our common stock. In addition, if we are unable to continue to meet these requirements, we may not be able to remain listed on NASDAQ.
27
We have identified material weaknesses in our internal control over financial reporting. If we are unable to develop and maintain effective internal control over financial reporting, we may not be able to accurately report our financial results in a timely manner, which may adversely affect investor confidence in us, materially and adversely affect our business and operating results and expose us to potential litigation.
A material weakness is a deficiency, or a combination of deficiencies, in internal control over financial reporting such that there is a reasonable possibility that a material misstatement of our annual or interim consolidated financial statements will not be prevented or detected and corrected on a timely basis.
Management previously identified that a material weakness in internal control over financial reporting existed relating to the appropriate oversight and sufficient review of the work performed by third-party specialists on our behalf and the coordination of work being performed by more than one specialist. Such third-party specialists were used in the preparation of (i) our valuation of Contingent Consideration, (ii) our valuation of certain identified intangible assets and (iii) our purchase price allocation pursuant to ASC 805, Business Combinations, in connection with our acquisition of PandoLogic Ltd. The material weakness resulted in the restatement of the unaudited condensed consolidated financial statements as of and for the three months ended March 31, 2022 and immaterial misstatements to the consolidated financial statements for the year ended December 31, 2021. Additionally, this material weakness could have resulted in a misstatement of certain accounting estimates or disclosures that would have resulted in a material misstatement of our annual consolidated financial statements that would not have been prevented or detected on a timely basis.
Management has also identified a material weakness in internal control over financial reporting relating to information technology general controls (“ITGCs”) in the areas of user access and change-management over certain information technology (“IT”) systems that support our financial reporting processes. Our business process automated and manual controls that are dependent on the affected ITGCs were also deemed ineffective because they could have been adversely impacted. These control deficiencies were a result of user access and change management processes over certain IT systems. Although this material weakness did not result in any identified misstatements to the financial statements and there were no changes to previously released financial results, this material weakness could have resulted in a material misstatement to our annual or interim consolidated financial statements that would not be prevented or detected on a timely basis.
Effective internal control over financial reporting is necessary for us to provide reliable financial reports and prevent fraud. We continue to evaluate steps to remediate any existing material weakness. These remediation measures may be time consuming and costly and there is no assurance that these measures will ultimately have the intended effects.
In order to remediate the material weakness relating to appropriate oversight and sufficient review of the work performed by third-party specialists on our behalf and the coordination of work being performed by more than one specialist, we have implemented financial reporting control changes to address the material weakness relating to the process for evaluating the qualifications of third-party specialists, defining the scope of work to be performed by such specialists and reviewing all estimates and other work product prepared by specialists in September 2022. Management has taken steps to enhance our evaluation of the qualifications of third-party specialists, more accurately define the scope of work to be performed by such specialists and improve the review process for all estimates and other work product prepared by such specialists, including a detailed review of all such specialists’ work by our employees with the appropriate level of experience and knowledge to review the specialists’ work for compliance with accounting standards. During the third and fourth quarters of 2022, we completed our testing of the operating effectiveness of the implemented controls and found them to be effective. As a result, we have concluded this material weakness has been remediated as of December 31, 2022.
In order to remediate the material weakness relating to ITGCs, management is taking remediation actions including: (i) developing and enhancing IT compliance oversight capabilities with specific focus over identification and execution of appropriate ITGCs; (ii) developing a training program addressing ITGCs and policies, including educating control owners concerning the principles and requirements of each control, with a focus on those related to user access and change management over IT systems impacting financial reporting; (iii) developing and maintaining documentation of underlying ITGCs to promote knowledge transfer upon personnel and function changes; and (iv) implementing an IT management review and testing plan to monitor ITGCs with a specific focus on systems supporting our financial reporting processes. To further remediate the existing material weakness identified herein, the management team, including the Chief Executive Officer and Chief Financial Officer, have reaffirmed and re-emphasized the importance of internal controls, control consciousness and a strong control environment.
If we are not able to remediate the existing material weakness, or if we identify any new material weaknesses in the future, we may be unable to maintain compliance with the requirements of securities laws, stock exchange listing rules, or
28
debt instrument covenants regarding timely filing of information; we could lose access to sources of capital or liquidity; and investors may lose confidence in our financial reporting and our stock price may decline as a result. Though we are taking steps to remediate the material weakness, we cannot be assured that the measures we have taken to date, or any measures we may take in the future, will be sufficient to remediate the material weakness or avoid potential future material weaknesses.
As a result of the material weakness described above and other related matters raised or that may in the future be identified, we face potential for adverse regulatory consequences, including investigations, penalties or suspensions by the SEC or NASDAQ, litigation or other disputes which may include, among others, claims invoking the federal and state securities laws, contractual claims or other claims arising from the restatement and material weakness in our internal control over financial reporting and the preparation of our consolidated financial statements. As of the date of this filing, we have no knowledge of any such regulatory consequences, litigation, claim or dispute. However, we can provide no assurance that such regulatory consequences, litigation, claim or dispute will not arise in the future. Any such regulatory consequences, litigation, claim or dispute, whether successful or not, could subject us to additional costs, divert the attention of our management, or impair our reputation. Each of these consequences could have a material adverse effect on our business, results of operations and financial condition.
We are a “smaller reporting company” under the U.S. federal securities laws, and the reduced reporting requirements applicable to smaller reporting companies could make our common stock less attractive to investors.
We are a “smaller reporting company,” and prior to December 31, 2022, we were an “emerging growth company” under U.S. federal securities laws. For as long as we continue to be a smaller reporting company, we may take advantage of exemptions from various reporting requirements that are applicable to other public companies that are not smaller reporting companies, including reduced disclosure obligations regarding executive compensation in our periodic reports and proxy statements. Furthermore, in prior years, as an emerging growth company, we took advantage of exemptions from further reporting requirements including not being required to comply with the auditor attestation requirements of Section 404 of the Sarbanes-Oxley Act and exemptions from the requirements of holding a non-binding advisory vote on executive compensation. Investors may not find our common stock attractive because we may rely on these exemptions and reduced disclosures. If some investors find our common stock less attractive as a result, there may be a less active trading market for our common stock and our stock price may be more volatile.
Our anti-takeover provisions could prevent or delay a change in control of our company, even if such change in control would be beneficial to our stockholders.
Provisions of our amended and restated certificate of incorporation and amended and restated bylaws as well as provisions of Delaware law could discourage, delay or prevent a merger, acquisition or other change in control of our company, even if such change in control would be beneficial to our stockholders. These include:
In addition, the Delaware General Corporation Law prohibits us, except under specified circumstances, from engaging in any mergers, significant sales of stock or assets or business combinations with any stockholder or group of stockholders who owns at least 15% of our common stock.
Additionally, certain provisions in the indenture governing our convertible senior notes may make it more difficult or expensive for a third party to acquire us. For example, the indenture will generally require us to repurchase the convertible senior notes for cash upon the occurrence of a fundamental change of us and, in certain circumstances, to increase the
29
conversion rate for a holder that converts its convertible senior notes in connection with a make-whole fundamental change. A takeover of us may trigger the requirement that we repurchase the convertible senior notes and/or increase the conversion rate, which could make it more costly for a potential acquiror to engage in such takeover. Such additional costs may have the effect of delaying or preventing a takeover of us that would otherwise be beneficial to stockholders.
Our amended and restated certificate of incorporation designates the Court of Chancery of the State of Delaware as the sole and exclusive forum for certain types of actions and proceedings that may be initiated by our stockholders, which could limit our stockholders’ ability to obtain a favorable judicial forum for disputes with us or our directors, officers or other employees.
Our amended and restated certificate of incorporation provides that, unless we consent in writing to the selection of an alternative forum, the Court of Chancery of the State of Delaware shall be the sole and exclusive forum for:
Any person or entity purchasing or otherwise acquiring any interest in shares of our capital stock shall be deemed to have notice of and consented to this provision of our amended and restated certificate of incorporation. This choice-of-forum provision may limit a stockholder’s ability to bring a claim in a judicial forum that it finds favorable or convenient for disputes with us or our directors, officers or other employees, which may discourage such lawsuits against us and our directors, officers and other employees. Alternatively, if a court were to find these provisions of our amended and restated certificate of incorporation inapplicable to, or unenforceable in respect of, one or more of the specified types of actions or proceedings, we may incur additional costs associated with resolving such matters in other jurisdictions, which could adversely affect our business, financial condition or results of operations.
Conversion or exercise of outstanding equity-lined securities may dilute the ownership interest of our stockholders or may otherwise depress the price of our common stock.
We have a substantial number of shares of our common stock reserved for issuance upon the exercise of stock options, settlement of restricted stock units and upon conversion of our convertible senior notes. The exercise or conversion of some or all of these securities may dilute the ownership interests of our stockholders. Upon conversion of our convertible senior notes, we have the option to pay or deliver, as the case may be, cash, shares of our common stock, or a combination of cash and shares of our common stock. If we elect to settle our conversion obligation in shares of our common stock or a combination of cash and shares of our common stock, any sales in the public market of our common stock issuable upon such conversion could adversely affect prevailing market prices of our common stock. In addition, the existence of the convertible senior notes may encourage short selling by market participants because the conversion of the notes could be used to satisfy short positions, or anticipated conversion of the notes into shares of our common stock could depress the price of our common stock.
If securities or industry analysts do not publish research or publish inaccurate or unfavorable research about our business, our stock price and trading volume could decline.
The trading market for our common stock will rely in part on the research and reports that securities or industry analysts publish about us and our business. If one or more of the analysts who cover us downgrades our common stock or issues other unfavorable commentary or research the price of our common stock may decline. If one or more analysts ceases coverage of our company or fails to publish reports on us regularly, demand for our stock could decrease, which in turn could cause the trading price or trading volume of our common stock to decline and could result in the loss of all or part of your investment in us.
30
Item 1B. Unresolved Staff Comments.
None.
Item 2. Properties.
Our principal executive offices are located in Denver, Colorado, which we lease under a lease expiring on September 30, 2023.
In addition to our principal executive offices, we lease office space in Irvine, California; New York, New York; and Herzliya, Israel.
We lease all of our facilities and do not own any real property. We believe our facilities are adequate and suitable for our current needs and that, should it be needed, suitable additional or alternative space will be available to accommodate our operations.
Item 3. Legal Proceedings.
From time to time, we may be involved in litigation relating to claims arising out of our operations in the normal course of business. We currently are not a party to any legal proceedings, the adverse outcome of which, in management’s opinion, individually or in the aggregate, would have a material adverse effect on our results of operations, financial position or cash flows. Regardless of the outcome, any litigation may have an adverse impact on us due to defense and settlement costs, diversion of management resources and other factors.
Item 4. Mine Safety Disclosures.
Not Applicable.
31
PART II
Item 5. Market for Registrant’s Common Equity, Related Stockholder Matters and Issuer Purchases of Equity Securities.
Market Information and Holders
Our common stock is listed on the NASDAQ under the ticker symbol “VERI.” As of March 10, 2023, we had 47 holders of record of our common stock based upon the records of our transfer agent, which do not include beneficial owners of common stock whose shares are held in the names of various securities brokers, dealers and registered clearing agencies.
Dividend Policy
We have never declared or paid cash dividends on our capital stock. We currently intend to retain all available funds and any future earnings for use in the operation of our business. Therefore, we do not currently expect to pay any cash dividends on our common stock for the foreseeable future. Any future determination to pay cash dividends will be at the discretion of our Board and will depend upon our results of operations, financial condition, capital requirements, general business conditions, and other factors that our Board deems relevant. Our ability to pay dividends may also be restricted by the terms of any future credit agreement or any future debt or preferred equity securities.
Recent Sales of Unregistered Equity Securities
None.
Purchases of Equity Securities
None.
Performance Graph
As a smaller reporting company, we are not required to provide the performance graph required by Item 201(e) of Regulation S-K.
Item 6. Reserved.
32
Item 7. Management’s Discussion and Analysis of Financial Condition and Results of Operations.
Forward-Looking Statements
The following discussion and analysis of our financial condition and results of operations should be read together with, and is qualified in its entirety by reference to the consolidated financial statements and related notes that are included elsewhere in this Annual Report on Form 10-K. This discussion contains forward-looking statements based upon current expectations that involve risks and uncertainties. Our actual results may differ materially from those anticipated in these forward-looking statements as a result of various factors, including those discussed under “Item 1A. Risk Factors” of Part I of this Annual Report on Form 10-K and our other filings with the Securities and Exchange Commission (“SEC”), including future SEC filings. See “Cautionary Note Regarding Forward-Looking Statements.”
Overview
We are a provider of AI solutions, powered by our proprietary AI operating system, aiWARE, to deliver differentiated products and solutions to our Commercial Enterprise and Government & Regulated Industries customers.
During the year ended December 31, 2022, we generated revenue of $149.7 million as compared to $115.3 million during the year ended December 31, 2021. Our Software Products & Services grew 42% year over year and represented 56% and 51% of our consolidated revenue in the years ended December 31, 2022 and 2021, respectively, and our Managed Services grew 17% year over year, and represented 44% and 49% of our consolidated revenue in the years ended December 31, 2022 and 2021, respectively. During the years ended December 31, 2022 and 2021, our largest customer represented approximately 25% and 30% of our consolidated revenue, respectively.
Recent Developments
In November 2021, we completed an offering of convertible senior notes in which we issued, at par value, $201.25 million aggregate principal amount of 1.75% convertible senior notes due 2026 (the “Convertible Notes”). In December 2022, we repurchased $60.0 million aggregate principal amount of the Convertible Notes at approximately sixty-five percent (65%) of par (the "Repurchase Transaction"), generating a cash gain of approximately $21.0 million. After the completion of the Repurchase Transaction, we recorded a net $19.1 million debt extinguishment gain and, as a result of the Repurchase Transaction, we have $141.3 million in aggregate principal amount of the Convertible Notes remaining outstanding.
Throughout 2022, we made several acquisitions, including an influencer-based management company in March, a company specializing in the creation of personalized synthetic voices called VocaliD in June, and the assets of Vision Semantics Limited, a U.K.-based company focused on AI-powered video analytics and surveillance software solutions in August (collectively, the "2022 Acquisitions"). The aggregate purchase consideration of the 2022 Acquisitions was $11.2 million, which consisted of cash payments of $4.8 million at closing, stock of $1.9 million, future earnout payments up to $4.5 million, and deferred cash payments to be made in 2023 and 2024 totaling $4.7 million, net of other purchase price adjustments of $0.3 million.
In September 2022, we and the legacy shareholders of PandoLogic entered into an amendment (the “Amendment”) to the PandoLogic Merger Agreement. The Amendment provides that the 2022 PandoLogic Earnout will be no less than $10.8 million (the “Minimum 2022 Earnout Amount”), payable with a target of approximately 67% in cash and 33% in stock calculated at a price of $20.52 per share, irrespective of the actual financial performance of PandoLogic for the 2022 PandoLogic Earnout period. In exchange for the Minimum 2022 Earnout Amount, the Amendment further provides that certain restrictive operational covenants and obligations imposed on us during the 2022 PandoLogic Earnout period would terminate as of the date of the Amendment and provides for the early release of certain escrow funds to us and to the paying agent for further distribution to the certain PandoLogic shareholders and employees under the PandoLogic Merger Agreement. The Amendment also provides for releases as to certain matters related to the PandoLogic Merger Agreement and the Amendment.
Effective December 31, 2022, Chad Steelberg resigned as our Chief Executive Officer and, effective January 1, 2023, our Board of Directors appointed Ryan Steelberg as President and Chief Executive Officer of the Company ("CEO"). Chad Steelberg will continue to provide services to us in his role as Chairman of the Board of Directors and as a consultant to the
33
Company. In January 2023, we entered into new employment agreements with Ryan Steelberg and Michael L. Zemetra, our Chief Financial Officer.
On January 4, 2023, we entered into a consulting agreement (the “Consulting Agreement”) with Steel Holdings, LLC, an entity affiliated with Chad Steelberg. Pursuant to the Consulting Agreement, we retained Chad Steelberg as a consultant to provide ongoing transition services related to Ryan Steelberg’s appointment as CEO and to manage and oversee the further development of our aiWARE platform.
On January 31, 2023, we announced strategic cost reduction initiatives with the aim of achieving net annualized savings of $12 to $15 million over the course of fiscal 2023. As part of this initiative, we engaged in a headcount reduction during the first quarter of 2023. In addition, we plan to divest our energy group in the first half of 2023, and we intend to reduce and consolidate expenses tied to software, outside services, and cloud-based processing throughout 2023.
Opportunities, Challenges and Risks
In 2022 and 2021, we derived our revenue primarily through our Commercial Enterprise customers, and secondarily, through our Government & Regulated Industries customers.
We are a leader in AI-based Software Products & Services. Our proprietary AI operating system, aiWARE, uses machine learning algorithms, or AI models, together with a suite of powerful applications, to reveal valuable insights from vast amounts of structured and unstructured data. In addition to the 42% increase in our Software Products & Services during the year ended December 31, 2022 as compared to the prior year, we have also demonstrated our ability to grow our AI-based Managed Services, with our revenue from these Managed Services increasing by 17% during the year ended December 31, 2022 as compared to the prior year. Historically, we have derived a large portion of our Software Products & Services revenue from applications we internally developed from our aiWARE platform and actively sold across various customers, but our growth in 2022 was driven by the inclusion of PandoLogic in our financial results for the entirety of 2022 as compared to 2021 when we acquired PandoLogic in September 2021. Beginning in the second half of 2021, we realigned our organization to also focus on enterprise sales and opportunities across existing and newer markets. While management believes there is a substantial opportunity to increase revenue longer term, current economic conditions have negatively impacted our business operations and financial results, and there is no certainty that any future investments, which could be significant and include future potential acquisitions, will result in significant enterprise revenue realization or revenue growth when compared with historical revenue. Nevertheless, we continue to see significant opportunities for growth in our Software Products & Services and our aiWARE platform sales to existing and newly acquired customers, and where our AI solutions could add tremendous value in content creation and distribution, including in the news, television and film industries.
We believe there will be significant near and long-term opportunities for revenue growth from Government & Regulated Industries markets due to customer adoption of our products and services related to AI technologies and more recently with our official Authorization to Operate, or ATO, of our aiWARE platform across the entire U.S. Department of Justice and progress with the Joint Artificial Intelligence Commission (“JAIC”) and Department of Defense (“DOD”). However, many enterprise-level opportunities with Government & Regulated Industries customers can involve long sales cycles, during which we must invest significant time and resources without a guarantee of success. We may seek to acquire businesses with deep relationships and greater scale within the U.S. government and within regulated industries to further accelerate our pursuit of the growth opportunities we see in this market.
During the second half of 2020, we launched our Veritone energy solutions as part of our Government & Regulated Industries solutions to help utilities increase profitability and improve grid reliability as they make the transition to renewables. Today, our energy solutions are in production at a major utility and being deployed across global manufactures. While we believe our energy solutions have significant long term value, our aiWARE platform is in the early stages of deployment in this market, and given the current macroeconomic environment, coupled with the fact that we will need to continue making significant investments in product, sales and engineering to further develop current and future solutions, we have elected to divest our energy group in the first half of 2023.
Growing our existing and new Software Products & Services customer base is critical for our success. During the year ended December 31, 2022, ending Software Products & Services customers grew to 642, a 21% increase year over year. While our overall customer growth has been significant, we did experience a slowdown in our Average Annual Revenue (AAR) per customer (as defined and discussed below under “—Non-GAAP Financial Measures”) beginning in our second quarter of 2022, which was principally driven by the reduction in hiring consumption from our largest customer, Amazon. For the large part of 2021 through the first quarter of 2022, Amazon utilized our hiring platform to support its growth during
34
the COVID-19 pandemic. In the beginning in the second quarter of 2022, the COVID-19 pandemic improved and many consumers returned to in person experiences, including for shopping. As a result, Amazon substantially slowed its hiring efforts around its warehouse and distribution services throughout the remainder of 2022, and created significant fluctuations in our quarterly results in 2022. While we do not expect the same level of fluctuation from Amazon in 2023 as compared to 2022, given Amazon’s high concentration of revenue on our consolidated results, our revenue results may continue to fluctuate significantly year over year based upon its hiring patterns. To reduce this risk, we continue to aggressively invest in existing and growing new customers. We also grew PandoLogic’s customer base as of December 31, 2022 by 22% year over year. Additionally, PandoLogic’s non-volume hiring revenue for the year ended December 31, 2022, which excludes Amazon, grew over 75% year over year.
Additionally, and as a result of the recent pullback in the macroeconomic environment caused by high inflation, rising interest rates and recent and potential future disruptions in access to bank deposits or lending commitments due to bank failures, we expect some of our customers may reduce advertising spending across our managed services in 2023 when compared to same periods in the prior year. In addition, if the U.S. government officially declares the U.S. is in a recession in 2023, we may see additional declines in existing and new customers consumption of our Software Products & Services. To mitigate against these risks, we have been investing aggressively in existing customers and acquiring new customers, and more recently announced certain cost reduction initiatives in the first quarter of 2023. As a result of continuing to diversify our customer base and increase sales within our existing customer base, we intend to continue to increase our sales and marketing spending in the near term as compared to the trailing twelve months; however, these increased investments will be somewhat offset by our 2023 cost reduction initiatives.
We believe our Software Products & Services will extend the capabilities of many third-party software platforms and products that are widely used today. For example, we believe that, when integrated with aiWARE, our hiring solutions customers will be given greater visibility and transparency in their hiring processes. In addition, we have historically integrated aiWARE across many platforms, including Alteryx, Snowflake and the NVIDIA® CUDA® GPU-based platform, enabling dramatic increases in aiWARE’s processing speed and providing a wide range of new use cases for our technology. We are in the process of developing and marketing more specific use cases for these and future integrations, which we believe will open up new markets for our products and accelerate our long term revenue growth opportunities.
For the year ended December 31, 2022, our total revenues increased to $149.7 million compared to $115.3 million for the year ended December 31, 2021, an increase of 30%. For the year ended December 31, 2022, our total loss from operations decreased to $38.0 million compared to $61.4 for the year ended December 31, 2021, a decrease of 38%. For the year ended December 31, 2022, our non-GAAP gross margin (calculated as described in “Non-GAAP Financial Measures” below) improved to approximately 82% compared with approximately 81% for the year ended December 31, 2021, driven by growth of new customers across our Software Products & Services and the inclusion of a full year of our hiring solutions revenue results, which collectively generated incremental non-GAAP gross margins in excess of 80% during the year ended December 31, 2022. Our non-GAAP gross margin is impacted significantly by the mix of our Software Products & Services and our Managed Services revenue in any given period because our Managed Services revenue typically has a lower overall non-GAAP gross margin than our Software Products & Services revenue. Our non-GAAP gross profit (see “Non-GAAP Financial Measures” below) is also dependent upon our ability to grow our revenue by expanding our customer base and increasing business with existing customers, and to manage our costs by negotiating favorable economic terms with cloud computing providers such as AWS and Microsoft Azure. While we are focused on continuing to improve our non-GAAP gross profit, our ability to attract and retain customers to grow our revenue will be highly dependent on our ability to implement and continually improve upon our technology and services and improve our technology infrastructure and operations as we experience increased network capacity constraints due to our growth.
We believe our operating results and performance are, and will continue to be, driven by various factors that affect our industry. Our ability to attract, grow and retain customers for our aiWARE platform is highly sensitive to rapidly changing technology and is dependent on our ability to maintain the attractiveness of our platform, content and services to our customers. Our future revenue and operating growth will rely heavily on our ability to grow and retain our Software Products & Services customer base, continue to develop and deploy quality and innovative AI-driven applications and enterprise-level offerings, provide unique and attractive content and advertising services to our customers, continue to grow in newer markets such as Government & Regulated Industries, expand aiWARE into larger and more expansive enterprise engagements and manage our corporate overhead costs. While we believe we will be successful in these endeavors, we cannot guarantee that we will succeed in generating substantial long term operating growth and profitability.
We expect to continue pursuing a strategy of acquiring companies to help accelerate our organic growth. We believe there are strategic acquisition targets that can accelerate our entry into and expand our existing market share in key strategic
35
markets, as well as our ability to grow our business. As a result, we will continue to prioritize corporate development efforts throughout 2023. Our acquisition strategy is threefold: (i) to increase the scale of our business in markets we are in today, (ii) to accelerate growth in new markets and product categories, including expanding our existing engineering and sales resources, and (iii) to accelerate the adoption of aiWARE as the universal AI operating system through venture or market-driven opportunities.
During the year ended December 31, 2022, we reported a net loss of $25.6 million as compared to a net loss of $64.7 million during the year ended December 31, 2021. During the year ended December 31, 2022, we reported a non-GAAP net loss of $15.9 million as compared to non-GAAP net income of $6.8 million during the year ended December 31, 2021. To continue to grow our revenue, we will continue to make targeted investments in people, namely software engineers and sales personnel. For example, our net headcount grew approximately 24% since the beginning of 2022. In addition, during the year ended December 31, 2022 we made substantial investments in our existing employee base, including higher annual raises and increased benefits, in order to compete in a challenging and constrained labor environment. Lastly, we made investments in our corporate infrastructure, including new ERP and workforce systems to help us better manage the scale and growth of our business. However, considering the current challenging macro-economic environment in the first half of 2023, we have made and are continuing to make significant cost reductions to our operating structure to better streamline our business and prioritization around our growth and corresponding investments. These cost reduction initiatives began in the latter half of 2022 and will continue through the first half of 2023, and include reductions in workforce and certain legacy operating costs, as well as the divestiture of our energy group. As a result of these initiatives, we believe we will be able to accelerate our pathway toward long term profitability.
In the years ended December 31, 2022 and 2021, substantially all of our revenue was derived from customers located in the United States. We believe that there is a substantial opportunity over time for us to expand our service offerings and customer base in countries outside of the United States. In the long term, we plan to expand our business further internationally in places such as Europe, Asia Pacific and Latin America, and as a result, we expect to continue to incur significant incremental upfront expenses associated with these expansion opportunities.
Impact of the COVID-19 Pandemic and Current Global Economic Conditions
The COVID-19 outbreak emerged in late 2019 and was declared a global pandemic by the World Health Organization in March 2020. The continuing COVID-19 pandemic has had, and will likely continue to have, a severe negative impact on the global economy. The ultimate impact of the COVID-19 pandemic on our business, results of operations, financial condition and cash flows is dependent on future developments, including the duration of the pandemic in other countries such as China, the impact on the businesses of our customers, and the duration of the resulting negative macroeconomic conditions, all of which are uncertain and are difficult to predict at this time.
In addition to continued market disruptions caused by the COVID-19 pandemic, global economic and business activities continue to face widespread macroeconomic uncertainties, including labor shortages, inflation and monetary supply shifts, recession risks and disruptions from the Russia-Ukraine conflict. The extent of the impact of these factors on our operational and financial performance, including our ability to execute our business strategies and initiatives in the expected time frame, will depend on future developments, and the impact on our customers, partners and employees, all of which are uncertain and cannot be predicted. These global economic conditions and any continued or new disruptions caused by these conditions may negatively impact our business in a number of ways. For example, our hiring solutions are sold to businesses whose financial conditions fluctuate based on general economic and business conditions, particularly the overall demand for labor and the economic health of current and prospective employers. In fiscal 2021, the COVID-19 pandemic forced certain technology and ecommerce companies, like Amazon, to increase hiring to meet increased demand. This in turn increased the overall consumption and use of our hiring solutions, and corresponding revenue. In fiscal 2022, with the easing of COVID-19 restrictions and higher inflation worldwide, demand for certain ecommerce services declined. As a result, companies adversely impacted by this shift in consumer behavior, including Amazon, experienced a decline in the demand for hiring and the consumption of our hiring solutions and corresponding revenue declined.
To the extent that economic uncertainty or attenuated economic conditions cause our customers and potential customers to freeze or reduce their headcount as we experienced throughout 2022, and reduce their advertising spending, demand for our products and services may be negatively affected in 2023 and beyond. These adverse economic conditions could also result in reductions in sales of our applications, longer sales cycles, reductions in contract duration and value, slower adoption of new technologies and increased price competition. In addition, economic recessions have historically resulted in overall reductions in spending on software and technology solutions as well as pressure from customers and potential customers for extended billing terms. If economic, political, or market conditions deteriorate, or if there is uncertainty around these conditions, our customers and potential customers may elect to decrease their software and
36
technology solutions budgets by deferring or reconsidering product purchases, which would limit our ability to grow our business and negatively affect our operating results. Any of these events would likely have an adverse effect on our business, operating results and financial position.
Non-GAAP Financial Measures
In evaluating our cash flows and financial performance, we use certain non-GAAP financial measures, including “Pro Forma Revenue,” “Average Annual Revenue (AAR),” “non-GAAP gross profit,” “non-GAAP gross margin,” “Non-GAAP net loss (pro forma),” “non-GAAP net income (loss),” and “non-GAAP net income (loss) per share.” Pro Forma Revenue includes historical Software Products & Services revenue from the past six fiscal quarters of each of Veritone, Inc. and PandoLogic Ltd. (unaudited) and presents such revenue on a combined pro forma basis treating PandoLogic Ltd. as owned by Veritone, Inc. since January 1, 2021. Average Annual Revenue (AAR) is calculated as the aggregate of trailing twelve-month Software Products & Services Pro Forma Revenue divided by the average number of customers over the same period for both Veritone, Inc. and PandoLogic Ltd. Non-GAAP gross profit is the Company’s revenue less its cost of revenue. Non-GAAP gross margin is defined as Non-GAAP gross profit divided by revenue. Non-GAAP net loss (pro forma) is the Company’s net loss excluding the items set forth below presented on a combined pro forma basis treating PandoLogic Ltd. as owned by Veritone, Inc. since January 1, 2021. Non-GAAP net income (loss) and non-GAAP net income (loss) per share is the Company’s net income (loss) and net income (loss) per share, adjusted to exclude interest expense, provision for income taxes, depreciation expense, amortization expense, stock-based compensation expense, changes in fair value of warrant liability, changes in fair value of contingent consideration, a reserve for state sales taxes, charges related to a facility sublease, gain on sale of asset, warrant expense, acquisition and due diligence costs, and severance and executive search costs. The results for non-GAAP net income (loss), are presented below for the years ended December 31, 2022 and 2021. The items excluded from these non-GAAP financial measures, as well as a breakdown of GAAP net loss, non-GAAP net income (loss) and these excluded items between our Core Operations and Corporate, are detailed in the reconciliation below.
In addition, we have provided supplemental non-GAAP measures of gross profit, operating expenses, loss from operations, other (expense) income, net, and loss before income taxes, excluding the items excluded from non-GAAP net loss as noted above, and reconciling such non-GAAP measures to the most directly comparable GAAP measures.
We present these non-GAAP financial measures because management believes such information to be important supplemental measures of performance that are commonly used by securities analysts, investors and other interested parties in the evaluation of companies in our industry. Management also uses this information internally for forecasting and budgeting. These non-GAAP financial measures are not calculated and presented in accordance with GAAP and should not be considered as an alternative to net income (loss), operating income (loss) or any other financial measures so calculated and presented, nor as an alternative to cash flow from operating activities as a measure of liquidity. Other companies (including our competitors) may define these non-GAAP financial measures differently. These non-GAAP measures may not be indicative of our historical operating results or predictive of potential future results. Investors should not consider this supplemental non-GAAP financial information in isolation or as a substitute for analysis of our results as reported in accordance with GAAP.
37
Reconciliation of GAAP net loss to Non-GAAP net loss
(in thousands) |
|
|
|
|
|
|
|
|
|
|
|
|
|
|
|
|
|
|
||||||
|
|
Year Ended December 31, |
|
|||||||||||||||||||||
|
|
2022 |
|
|
2021 |
|
||||||||||||||||||
|
|
Core Operations(1) |
|
|
Corporate(2) |
|
|
Total |
|
|
Core Operations(1) |
|
|
Corporate(2) |
|
|
Total |
|
||||||
Net income (loss) |
|
$ |
(19,027 |
) |
|
$ |
(6,530 |
) |
|
$ |
(25,557 |
) |
|
$ |
8,298 |
|
|
$ |
(72,970 |
) |
|
$ |
(64,672 |
) |
Provision for income taxes |
|
|
1,805 |
|
|
|
504 |
|
|
|
2,309 |
|
|
|
2,658 |
|
|
|
86 |
|
|
|
2,744 |
|
Depreciation and amortization |
|
|
21,936 |
|
|
|
557 |
|
|
|
22,493 |
|
|
|
8,984 |
|
|
|
426 |
|
|
|
9,410 |
|
Stock-based compensation expense |
|
|
10,138 |
|
|
|
8,977 |
|
|
|
19,115 |
|
|
|
6,575 |
|
|
|
33,488 |
|
|
|
40,063 |
|
Change in fair value of contingent consideration |
|
|
— |
|
|
|
(22,721 |
) |
|
|
(22,721 |
) |
|
|
— |
|
|
|
12,074 |
|
|
|
12,074 |
|
State sales tax reserve |
|
|
— |
|
|
|
— |
|
|
|
— |
|
|
|
— |
|
|
|
306 |
|
|
|
306 |
|
Interest expense, net |
|
|
— |
|
|
|
4,350 |
|
|
|
4,350 |
|
|
|
— |
|
|
|
493 |
|
|
|
493 |
|
Gain on debt extinguishment |
|
|
— |
|
|
|
(19,097 |
) |
|
|
(19,097 |
) |
|
|
— |
|
|
|
— |
|
|
|
— |
|
Acquisition and due diligence costs |
|
|
— |
|
|
|
2,688 |
|
|
|
2,688 |
|
|
|
— |
|
|
|
2,698 |
|
|
|
2,698 |
|
Charges related to sublease |
|
|
— |
|
|
|
— |
|
|
|
— |
|
|
|
— |
|
|
|
3,367 |
|
|
|
3,367 |
|
Severance and executive search |
|
|
512 |
|
|
|
28 |
|
|
|
540 |
|
|
|
— |
|
|
|
349 |
|
|
|
349 |
|
Non-GAAP Net Income (Loss) |
|
$ |
15,364 |
|
|
$ |
(31,244 |
) |
|
$ |
(15,880 |
) |
|
$ |
26,515 |
|
|
$ |
(19,683 |
) |
|
$ |
6,832 |
|
(1) Core operations consists of our consolidated Software Products & Services and Managed Services that include our content licensing and advertising services, and their supporting operations, including direct costs of sales as well as operating expenses for sales, marketing, and product development and certain general and administrative costs dedicated to these operations.
(2) Corporate consists of general and administrative functions such as executive, finance, legal, people operations, fixed overhead expenses (including facilities and information technology expenses), other income (expenses) and taxes, and other expenses that support the entire company, including public company driven costs.
For the year ended December 31, 2022, our total loss from operations decreased to $38.0 million compared to $61.4 for the year ended December 31, 2021. The following tables set forth the calculation of our non-GAAP gross profit and non-GAAP gross margin, followed by a reconciliation of non-GAAP to GAAP financial information presented in our consolidated financial statements for years ended December 31, 2022 and 2021.
(dollars in thousands) |
|
Year Ended |
|
|||||
|
|
2022 |
|
|
2021 |
|
||
Revenue |
|
$ |
149,728 |
|
|
$ |
115,305 |
|
Cost of revenue |
|
|
27,432 |
|
|
|
22,129 |
|
Non-GAAP gross profit |
|
|
122,296 |
|
|
|
93,176 |
|
Non-GAAP gross margin |
|
|
81.7 |
% |
|
|
80.8 |
% |
38
|
|
Year Ended |
|
|||||
|
|
2022 |
|
|
2021 |
|
||
Revenue |
|
$ |
149,728 |
|
|
$ |
115,305 |
|
Cost of revenue |
|
|
27,432 |
|
|
|
22,129 |
|
Non-GAAP gross profit |
|
|
122,296 |
|
|
|
93,176 |
|
|
|
|
|
|
|
|
||
GAAP cost of revenue |
|
|
27,432 |
|
|
|
22,129 |
|
Stock-based compensation expense |
|
|
(116 |
) |
|
|
(116 |
) |
Non-GAAP cost of revenue |
|
|
27,316 |
|
|
|
22,013 |
|
|
|
|
|
|
|
|
||
GAAP sales and marketing expenses |
|
|
51,345 |
|
|
|
28,935 |
|
Stock-based compensation expense |
|
|
(2,263 |
) |
|
|
(1,716 |
) |
Severance and executive search |
|
|
(86 |
) |
|
|
(236 |
) |
Non-GAAP sales and marketing expenses |
|
|
48,996 |
|
|
|
26,983 |
|
|
|
|
|
|
|
|
||
GAAP research and development expenses |
|
|
43,589 |
|
|
|
25,075 |
|
Stock-based compensation expense |
|
|
(5,056 |
) |
|
|
(3,217 |
) |
Severance and executive search |
|
|
(198 |
) |
|
|
(14 |
) |
Non-GAAP research and development expenses |
|
|
38,335 |
|
|
|
21,844 |
|
|
|
|
|
|
|
|
||
GAAP general and administrative expenses |
|
|
44,177 |
|
|
|
91,667 |
|
Depreciation |
|
|
(1,313 |
) |
|
|
(538 |
) |
Stock-based compensation expense |
|
|
(11,680 |
) |
|
|
(35,014 |
) |
Change in fair value of contingent consideration |
|
|
22,721 |
|
|
|
(12,074 |
) |
Charges related to sublease |
|
|
— |
|
|
|
(3,367 |
) |
State sales tax reserve |
|
|
— |
|
|
|
(306 |
) |
Acquisition and due diligence costs |
|
|
(2,688 |
) |
|
|
(2,698 |
) |
Severance and executive search |
|
|
(256 |
) |
|
|
(99 |
) |
Non-GAAP general and administrative expenses |
|
|
50,961 |
|
|
|
37,571 |
|
|
|
|
|
|
|
|
||
GAAP amortization |
|
|
(21,180 |
) |
|
|
(8,872 |
) |
|
|
|
|
|
|
|
||
GAAP loss from operations |
|
|
(37,995 |
) |
|
|
(61,373 |
) |
Total non-GAAP adjustments (1) |
|
|
22,115 |
|
|
|
68,267 |
|
Non-GAAP income (loss) from operations |
|
|
(15,880 |
) |
|
|
6,894 |
|
|
|
|
|
|
|
|
||
GAAP other income (expense), net |
|
|
14,747 |
|
|
|
(600 |
) |
Gain on debt extinguishment |
|
|
(19,097 |
) |
|
|
— |
|
Interest expense, net |
|
|
4,350 |
|
|
|
538 |
|
Non-GAAP other expense, net |
|
|
0 |
|
|
|
(62 |
) |
|
|
|
|
|
|
|
||
GAAP loss before income taxes |
|
|
(23,248 |
) |
|
|
(61,973 |
) |
Total non-GAAP adjustments (1) |
|
|
7,368 |
|
|
|
68,805 |
|
Non-GAAP income (loss) before income taxes |
|
|
(15,880 |
) |
|
|
6,832 |
|
|
|
|
|
|
|
|
||
Income tax provision |
|
|
2,309 |
|
|
|
2,699 |
|
|
|
|
|
|
|
|
||
GAAP net loss |
|
|
(25,557 |
) |
|
|
(64,672 |
) |
Total non-GAAP adjustments (1) |
|
|
9,677 |
|
|
|
71,504 |
|
Non-GAAP net income (loss) |
|
$ |
(15,880 |
) |
|
$ |
6,832 |
|
|
|
|
|
|
|
|
||
Shares used in computing non-GAAP basic net income (loss) per share |
|
|
36,034 |
|
|
|
33,298 |
|
Shares used in computing non-GAAP diluted net income (loss) per share |
|
|
36,034 |
|
|
|
43,928 |
|
Non-GAAP basic net income (loss) per share |
|
$ |
(0.44 |
) |
|
$ |
0.21 |
|
Non-GAAP diluted net income (loss) per share |
|
$ |
(0.44 |
) |
|
$ |
0.16 |
|
39
(1) Adjustments are comprised of the adjustments to GAAP cost of revenue, sales and marketing expenses, research and development expenses and general and administrative expenses and other (expense) income, net (where applicable) listed above.
Supplemental Financial Information
We are providing the following unaudited supplemental financial information regarding our Software Products & Services and Managed Services as a lookback of the prior year to explain our recent historical and year-over-year performance. The Software Products & Services supplemental financial information is presented on a pro forma basis, as further described below.
The supplemental financial information for our Software Products & Services includes: (i) Software Revenue – Pro Forma, (ii) Ending Software Customers, (iii) Average Annual Revenue (AAR), (iv) Total New Bookings, and (iv) Gross Revenue Retention, in each case as defined in the footnotes to the table below. The supplemental financial information for our Managed Services includes: (i) average gross billings per active agency client, and (ii) revenue.
Software Products & Services Supplemental Financial Information
The following table sets forth the results for each of our Software Products & Services supplemental financial information.
|
|
Quarter Ended |
|
|||||||||||||||||||||||||||||
|
|
Mar 31, |
|
|
Jun 30, |
|
|
Sept 30, |
|
|
Dec 31, |
|
|
Mar 31, |
|
|
Jun 30, |
|
|
Sept 30, |
|
|
Dec 31, |
|
||||||||
|
|
2021 |
|
|
2021 |
|
|
2021 |
|
|
2021 |
|
|
2022 |
|
|
2022 |
|
|
2022 |
|
|
2022 |
|
||||||||
Software Revenue - Pro Forma (in 000's) (1) |
|
$ |
10,183 |
|
|
$ |
20,072 |
|
|
$ |
21,860 |
|
|
$ |
40,223 |
|
|
$ |
18,167 |
|
|
$ |
18,379 |
|
|
$ |
20,812 |
|
|
$ |
27,220 |
|
Ending Software Customers (2) |
|
|
385 |
|
|
|
419 |
|
|
|
433 |
|
|
|
529 |
|
|
|
559 |
|
|
|
594 |
|
|
|
618 |
|
|
|
642 |
|
Average Annual Revenue (AAR) (in 000's) (3) |
|
$ |
199 |
|
|
$ |
203 |
|
|
$ |
208 |
|
|
$ |
209 |
|
|
$ |
207 |
|
|
$ |
187 |
|
|
$ |
170 |
|
|
$ |
140 |
|
Total New Bookings (in 000's) (4) |
|
$ |
2,442 |
|
|
$ |
4,896 |
|
|
$ |
3,356 |
|
|
$ |
8,317 |
|
|
$ |
9,574 |
|
|
$ |
14,658 |
|
|
$ |
16,548 |
|
|
$ |
20,047 |
|
Gross Revenue Retention (5) |
|
>90% |
|
|
>90% |
|
|
>90% |
|
|
>90% |
|
|
>90% |
|
|
>90% |
|
|
>90% |
|
|
>90% |
|
||||||||
(1) “Software Revenue - Pro Forma” includes historical Software Products & Services revenue from the past eight (8) fiscal quarters of each of Veritone, Inc. and PandoLogic (unaudited) and presents such revenue on a combined pro forma basis treating PandoLogic as owned by Veritone, Inc. since January 1, 2021.
(2) “Ending Software Customers” includes Software Products & Services customers as of the end of each respective quarter set forth above with trailing twelve-month revenues in excess of $2,400 for both Veritone, Inc. and PandoLogic and/or deemed by us to be under an active contract for the applicable periods.
(3) “Average Annual Revenue (AAR)” is calculated as the aggregate of trailing twelve-month Software Products & Services revenue divided by the average number of customers over the same period for both Veritone, Inc. and PandoLogic.
(4) “Total New Bookings” represents the total fees payable during the full contract term for new contracts received in the quarter (including fees payable during any cancellable portion and an estimate of license fees that may fluctuate over the term), excluding any variable fees under the contract (e.g., fees for cognitive processing, storage, professional services and other variable services).
(5) “Gross Revenue Retention”: We calculate our dollar-based gross retention rate as of the period end by starting with the revenue from Ending Software Customers for Software Products & Services as of the 3 months in the prior year quarter to such period, or Prior Year Quarter Revenue. We then deduct from the Prior Year Quarter Revenue any revenue from Ending Software Customers who are no longer customers as of the current period end, or Current Period Ending Customer Revenue. We then divide the total Current Period Ending Customer Revenue by the total Prior Year Quarter Revenue to arrive at our dollar-based gross retention rate, which is the percentage of revenue from all Ending Software Customers from our Software Products & Services as of the year prior that is not lost to customer churn.
40
As we grow our business for our Software Products & Services, we expect that our supplemental financial information will be impacted in different ways based on our customer profiles and the nature of target markets. For example, our PandoLogic business has significant revenue concentration in a single customer which has a material impact on the average contract value and gross retention. As a result, we have shown the supplemental financial information on a pro forma basis for comparability.
The following table sets forth the reconciliation of pro forma revenue to revenue and the calculation of AAR.
|
|
Quarter Ended |
|
|||||||||||||||||||||||||||||
|
|
Mar 31, |
|
|
Jun 30, |
|
|
Sept 30, |
|
|
Dec 31, |
|
|
Mar 31, |
|
|
Jun 30, |
|
|
Sept 30, |
|
|
Dec 31, |
|
||||||||
|
|
2021 |
|
|
2021 |
|
|
2021 |
|
|
2021 |
|
|
2022 |
|
|
2022 |
|
|
2022 |
|
|
2022 |
|
||||||||
Software Products & Services Revenue |
|
$ |
4,685 |
|
|
$ |
5,580 |
|
|
$ |
9,027 |
|
|
$ |
40,223 |
|
|
$ |
18,167 |
|
|
$ |
18,379 |
|
|
$ |
20,812 |
|
|
$ |
27,220 |
|
PandoLogic Revenue (1) |
|
|
5,498 |
|
|
|
14,492 |
|
|
|
12,833 |
|
|
|
— |
|
|
|
— |
|
|
|
— |
|
|
|
— |
|
|
|
— |
|
Software Revenue - Pro Forma |
|
$ |
10,183 |
|
|
$ |
20,072 |
|
|
$ |
21,860 |
|
|
$ |
40,223 |
|
|
$ |
18,167 |
|
|
$ |
18,379 |
|
|
$ |
20,812 |
|
|
$ |
27,220 |
|
Managed Services Revenue |
|
|
13,610 |
|
|
|
13,626 |
|
|
|
13,628 |
|
|
|
14,926 |
|
|
|
16,240 |
|
|
|
15,856 |
|
|
|
16,384 |
|
|
|
16,670 |
|
Total Pro Forma Revenue |
|
$ |
23,793 |
|
|
$ |
33,698 |
|
|
$ |
35,488 |
|
|
$ |
55,149 |
|
|
$ |
34,407 |
|
|
$ |
34,235 |
|
|
$ |
37,196 |
|
|
$ |
43,890 |
|
|
|
Trailing Twelve Months Ended |
|
|||||||||||||||||||||||||||||
|
|
Mar 31, |
|
|
Jun 30, |
|
|
Sept 30, |
|
|
Dec 31, |
|
|
Mar 31, |
|
|
Jun 30, |
|
|
Sept 30, |
|
|
Dec 31, |
|
||||||||
|
|
2021 |
|
|
2021 |
|
|
2021 |
|
|
2021 |
|
|
2022 |
|
|
2022 |
|
|
2022 |
|
|
2022 |
|
||||||||
Software Products & Services Revenue |
|
$ |
15,439 |
|
|
$ |
18,017 |
|
|
$ |
23,693 |
|
|
$ |
59,515 |
|
|
$ |
72,997 |
|
|
$ |
85,796 |
|
|
$ |
97,581 |
|
|
$ |
84,578 |
|
PandoLogic Revenue (1) |
|
|
50,283 |
|
|
|
57,262 |
|
|
|
59,292 |
|
|
|
32,824 |
|
|
|
27,325 |
|
|
|
12,833 |
|
|
|
— |
|
|
|
— |
|
Software Revenue - Pro Forma |
|
$ |
65,722 |
|
|
$ |
75,279 |
|
|
$ |
82,985 |
|
|
$ |
92,339 |
|
|
$ |
100,322 |
|
|
$ |
98,629 |
|
|
$ |
97,581 |
|
|
$ |
84,578 |
|
Managed Services Revenue |
|
|
43,845 |
|
|
|
52,019 |
|
|
|
53,279 |
|
|
|
55,789 |
|
|
|
58,419 |
|
|
|
60,546 |
|
|
|
63,406 |
|
|
|
65,150 |
|
Total Pro Forma Revenue |
|
$ |
109,567 |
|
|
$ |
127,298 |
|
|
$ |
136,264 |
|
|
$ |
148,128 |
|
|
$ |
158,741 |
|
|
$ |
159,175 |
|
|
$ |
160,987 |
|
|
$ |
149,728 |
|
|
|
|
|
|
|
|
|
|
|
|
|
|
|
|
|
|
|
|
|
|
|
|
|
|
||||||||
Average Number of Customers - Pro Forma |
|
|
330 |
|
|
|
372 |
|
|
|
399 |
|
|
|
442 |
|
|
|
485 |
|
|
|
529 |
|
|
|
575 |
|
|
|
603 |
|
Average Annual Revenue (AAR) |
|
$ |
199 |
|
|
$ |
203 |
|
|
$ |
208 |
|
|
$ |
209 |
|
|
$ |
207 |
|
|
$ |
187 |
|
|
$ |
170 |
|
|
$ |
140 |
|
Managed Services Supplemental Financial Information
The following table sets forth the results for each of the key performance indicators for Managed Services.
|
|
Quarter Ended |
|
|||||||||||||||||||||||||||||
|
|
Mar 31, |
|
|
Jun 30, |
|
|
Sept 30, |
|
|
Dec 31, |
|
|
Mar 31, |
|
|
Jun 30, |
|
|
Sept 30, |
|
|
Dec 31, |
|
||||||||
|
|
2021 |
|
|
2021 |
|
|
2021 |
|
|
2021 |
|
|
2022 |
|
|
2022 |
|
|
2022 |
|
|
2022 |
|
||||||||
Avg billings per active Managed Services client (in 000's) (6) |
|
$ |
582 |
|
|
$ |
622 |
|
|
$ |
615 |
|
|
$ |
625 |
|
|
$ |
684 |
|
|
$ |
736 |
|
|
$ |
747 |
|
|
$ |
823 |
|
Revenue during quarter (in 000's) (7) |
|
$ |
10,327 |
|
|
$ |
9,968 |
|
|
$ |
9,647 |
|
|
$ |
10,857 |
|
|
$ |
10,735 |
|
|
$ |
9,625 |
|
|
$ |
10,035 |
|
|
$ |
11,074 |
|
(6) Avg billings per active Managed Services customer for each quarter reflects the average quarterly billings per active Managed Services customer over the twelve-month period through the end of such quarter for Managed Services customers that are active during such quarter.
(7) Managed Services revenue and metrics exclude content licensing and media services.
We have experienced and may continue to experience volatility in revenue from our Managed Services due to a number of factors, including: (i) the timing of new large customer agreements; (ii) loss of customers who choose to replace our services with new providers or by bringing their advertising placement in-house; (iii) customers who experience reductions in their advertising budgets due to issues with their own businesses; and (iv) the seasonality of the campaigns for certain large customers. We have historically generated a significant portion of our revenue from a few major customers. As we continue to grow and diversify our customer base, we expect that our dependency on a limited number of large customers will be minimized.
41
Net Loss Carryforwards
As of December 31, 2022, we had federal and state income tax net operating loss carryforwards (“NOLs”) totaling approximately $172.9 million and $122.3 million, respectively. The U.S. federal and state NOLs are projected to expire beginning in 2034 and 2030, respectively, unless previously utilized. The U.S. federal NOLs generated after January 1, 2018 may be carried forward indefinitely, subject to an 80% taxable income limitation on the utilization of the carryforwards.
In general, under Section 382 of the Internal Revenue Code of 1986, as amended (the “Code”), a corporation that undergoes an “ownership change” (generally defined as a cumulative change (by value) of more than 50% in the equity ownership of certain stockholders over a rolling three-year period) is subject to limitations on its ability to utilize its pre-change NOLs to offset post-change taxable income. Our existing NOLs may be subject to limitations arising from previous ownership changes, and our ability to utilize NOLs could be further limited by Section 382 of the Code. In addition, future changes in our stock ownership, some of which may be outside of our control, could result in an ownership change under Section 382 of the Code. The amount of such limitations, if any, has not been determined.
There is also a risk that due to other future regulatory changes, such as suspensions on the use of NOLs, or other unforeseen reasons, our existing NOLs could expire or otherwise be unavailable to offset future income tax liabilities. For these reasons, we may not be able to realize a tax benefit from the use of our NOLs, even if we attain profitability.
Critical Accounting Policies and Estimates
The preparation of financial statements in accordance with accounting principles generally accepted in the United States requires management to make estimates and assumptions about future events that affect amounts reported in our consolidated financial statements and related notes, as well as the related disclosure of contingent assets and liabilities at the date of the financial statements. Management evaluates its accounting policies, estimates and judgments on an on-going basis. Management bases its estimates and judgments on historical experience and various other factors that are believed to be reasonable under the circumstances. Actual results may differ from these estimates under different assumptions and conditions. The principal estimates relate to the accounting recognition and presentation of revenue, allowance for doubtful accounts, purchase accounting, impairment of long-lived assets, the valuation of contingent consideration, the valuation of non-cash consideration received in barter transactions and evaluation of realizability, the valuation of stock awards and stock warrants and income taxes, where applicable.
Management evaluated the development and selection of its critical accounting policies and estimates and believes that the following involve a higher degree of judgment or complexity and are most significant to reporting our results of operations and financial position and are therefore discussed as critical. The following critical accounting policies reflect the significant estimates and judgments used in the preparation of our consolidated financial statements. With respect to critical accounting policies, even a relatively minor variance between expected and actual experience can potentially have a materially favorable or unfavorable impact on subsequent results of operations. More information on these critical accounting policies and our significant accounting policies can be found in Note 2 to our audited consolidated financial statements included in Part II, Item 8 (Financial Statements and Supplementary Data) of this Annual Report on Form 10-K.
Accounting for Business Combinations
As part of the purchase accounting for acquisitions, we estimate the fair values of the assets acquired and liabilities assumed. A fair value measurement is determined as the price we would receive to sell an asset or pay to transfer a liability in an orderly transaction between market participants at the measurement date. In the absence of active markets for the identical assets or liabilities, such measurements involve developing assumptions based on market observable data and, in the absence of such data, internal information that is consistent with what market participants would use in a hypothetical transaction that occurs at the measurement date. In the context of purchase accounting, the determination of fair value often involves significant judgments and estimates by management, including the selection of valuation methodologies, estimates of future revenues, costs and cash flows, discount rates, and selection of comparable companies. The fair values reflected in the purchase accounting rely on management’s judgment and the expertise of a third-party valuation firm engaged to assist in concluding on the fair value measurements.
Impairment of Goodwill and Long-Lived Assets
Goodwill is not amortized but instead is tested at least annually for impairment, or more frequently when events or changes in circumstances indicate that goodwill might be impaired. Our annual impairment test is performed during the second quarter. In assessing goodwill impairment, we have the option to first assess qualitative factors to determine whether
42
the existence of events or circumstances leads to a determination that the fair value of a reporting unit is less than its carrying amount. Our qualitative assessment of the recoverability of goodwill considers various macro-economic, industry-specific and company-specific factors. These factors include: (i) severe adverse industry or economic trends; (ii) significant company-specific actions, including exiting an activity in conjunction with restructuring of operations; (iii) current, historical or projected deterioration of our financial performance; or (iv) a sustained decrease in our market capitalization below its net book value. If, after assessing the totality of events or circumstances, we determine it is unlikely that the fair value of a reporting unit is less than its carrying amount, then a quantitative analysis is unnecessary. However, if we conclude otherwise, or if we elect to bypass the qualitative analysis, then we are required to perform a quantitative analysis that compares the fair value of the reporting unit with its carrying amount, including goodwill. If the fair value of the reporting unit exceeds its carrying amount, goodwill is not considered impaired; otherwise, a goodwill impairment loss is recognized for the lesser of: (a) the amount that the carrying amount of a reporting unit exceeds its fair value; or (b) the amount of the goodwill allocated to that reporting unit.
We review long-lived assets to be held and used, other than goodwill, for impairment at least annually, or whenever events or changes in circumstances indicate that the carrying amount may not be recoverable. If an evaluation of recoverability is required, the estimated undiscounted future cash flows directly associated with the asset are compared with the asset’s carrying amount. If the estimated future cash flows from the use of the asset are less than the carrying value, an impairment charge would be recorded to write down the asset to its estimated fair value.
Stock-Based Compensation Expense
We record stock-based compensation expense associated with restricted stock, restricted stock units and stock options granted under our stock incentive plans, and purchase rights granted under our Employee Stock Purchase Plan (“ESPP”). We have granted stock options with time-based vesting conditions, as well as performance-based stock options, the vesting of which is conditioned upon the achievement of specified target stock prices for our common stock (“Performance Options”). All Performance Options become exercisable in three equal tranches based on the achievement of specific market price targets for our common stock. For each tranche to become exercisable, the closing price per share of our common stock must meet or exceed the applicable stock price target for a period of 30 consecutive trading days. All stock options have terms of ten years following the grant date, subject to earlier termination in the case of cessation of the awardee’s continued service with us.
The fair values of restricted stock and restricted stock unit awards are based on the closing market price of our common stock on the date of grant.
We estimate the fair values of stock options having time-based vesting conditions, as well as purchase rights under our ESPP, using the Black-Scholes-Merton option pricing model. We estimate the fair values of Performance Options utilizing a Monte Carlo simulation model to estimate when the stock price targets will be achieved and the Black-Scholes-Merton option pricing model. A fair value is estimated for each tranche of such Performance Options that is tied to a particular stock price target.
Determining the appropriate fair values of stock options and ESPP purchase rights at the grant date requires significant judgment, including estimating the volatility of our common stock, the expected term of awards, and the derived service periods for each tranche of Performance Options. In determining fair values, we estimate volatility based on the historical volatility of our common stock along with the volatility of the peer group. In calculating estimated volatility, as the number of years of trading history for our common stock has increased, the volatility of our common stock has been given a weighting ranging from 25% to 75%, and the volatility of the peer group companies has been given a weighting ranging from 75% to 25%, with each peer company weighted equally. We will continue utilizing this combination and will periodically adjust the weightings as additional historical volatility data for our own shares of common stock becomes available.
The expected term for stock options other than Performance Options represents the period of time that stock options are expected to be outstanding and is determined using the simplified method. Under the simplified method, the expected term is calculated as the midpoint between the weighted average vesting date and the contractual term of the options. The expected term for Performance Options considers the remaining term of the option after the attainment date and the ratio of the stock price at the attainment date to the option exercise price.
The risk-free rate is based on the implied yield of U.S. Treasury notes as of the grant date with a remaining term approximately equal to the expected term of the award.
The fair value of stock-based awards (other than Performance Options) is amortized using the straight-line attribution method over the requisite service period of the award, which is generally the vesting period. For Performance Options,
43
expense is recognized over a graded-vesting attribution basis over the period from the grant date to the estimated attainment date, which is the derived service period of each tranche of the award.
We recognize actual forfeitures as they occur and do not estimate forfeitures in determining our stock-based compensation expense.
If Performance Options are modified, the fair values and the new derived service periods of the modified awards as of the date of modification and the fair values of the original awards immediately before the modification are determined. The amount of incremental compensation expense resulting from the modification of each award is equal to the excess of the fair value of the modified award on the date of modification over the fair value of the original award immediately before the modification. The incremental compensation expense is recognized over the new derived service period of the modified award.
Accounting for Income Taxes
We account for income taxes using the asset and liability method. Under this method, deferred tax assets and liabilities are established for temporary differences between the financial statement carrying amounts and the tax bases of our assets and liabilities using statutory tax rates expected to apply to taxable income in the years in which those temporary differences are expected to reverse.
We assess the likelihood that the deferred tax assets will be recovered from future taxable income and, if recovery is not more likely than not, we establish a valuation allowance to reduce the deferred tax assets to the amounts expected to be realized. Realization of the deferred tax assets is dependent on us generating sufficient taxable income in future years to obtain a benefit from the reversal of temporary differences and from net operating losses. Due to uncertainties related to the ability to utilize historical U.S. federal and state deferred tax assets in future periods, we have recorded a valuation allowance against these net deferred tax assets in the amount of $81.1 million, as of December 31, 2022. These assets consist primarily of net operating loss and tax credit carryovers and non-deductible stock-based compensation.
In connection with the acquisition of PandoLogic, a deferred tax liability is established for the future consequences attributable to differences between the financial statement carrying amounts of the acquired non-goodwill intangible assets and their respective tax basis. No deferred tax asset or liability is recorded on PandoLogic goodwill, $33,111 of which is not deductible for tax purposes.
Significant management judgment is required in determining our provision for income taxes, our deferred tax assets and liabilities and our valuation allowance. In assessing the need for a valuation allowance, management has considered both the positive and negative evidence available, including but not limited to, our prior history of net losses, projected future outcomes, industry and market trends and the nature of existing deferred tax assets. In management’s judgment, any positive indicators are outweighed by the uncertainties surrounding our estimates and judgments of potential future taxable income, due primarily to uncertainties surrounding the timing of realization of future taxable income. In the event that actual results differ from these estimates or we adjust these estimates should we believe we would be able to realize these deferred tax assets in the future, an adjustment to the valuation allowance would increase income in the period such determination was made.
44
Results of Operations
The following tables set forth our results of operations for the years ended December 31, 2022 and 2021, in dollars and as a percentage of our revenue for those periods. The period-to-period comparisons of our historical results are not necessarily indicative of the results that may be expected in the future.
(dollars in thousands) |
|
Year Ended |
|
|||||
|
|
2022 |
|
|
2021 |
|
||
Revenue |
|
$ |
149,728 |
|
|
$ |
115,305 |
|
Operating expenses: |
|
|
|
|
|
|
||
Cost of revenue |
|
|
27,432 |
|
|
|
22,129 |
|
Sales and marketing |
|
|
51,345 |
|
|
|
28,935 |
|
Research and development |
|
|
43,589 |
|
|
|
25,075 |
|
General and administrative |
|
|
44,177 |
|
|
|
91,667 |
|
Amortization |
|
|
21,180 |
|
|
|
8,872 |
|
Total operating expenses |
|
|
187,723 |
|
|
|
176,678 |
|
Loss from operations |
|
|
(37,995 |
) |
|
|
(61,373 |
) |
Other income (expense), net |
|
|
14,747 |
|
|
|
(600 |
) |
Loss before provision for income taxes |
|
|
(23,248 |
) |
|
|
(61,973 |
) |
Provision for income taxes |
|
|
2,309 |
|
|
|
2,699 |
|
Net loss |
|
$ |
(25,557 |
) |
|
$ |
(64,672 |
) |
|
|
Year Ended |
|
|||||
|
|
2022 |
|
|
2021 |
|
||
Revenue |
|
|
100.0 |
% |
|
|
100.0 |
% |
Operating expenses: |
|
|
|
|
|
|
||
Cost of revenue |
|
|
18.3 |
|
|
|
19.2 |
|
Sales and marketing |
|
|
34.3 |
|
|
|
25.1 |
|
Research and development |
|
|
29.1 |
|
|
|
21.7 |
|
General and administrative |
|
|
29.5 |
|
|
|
79.5 |
|
Amortization |
|
|
14.1 |
|
|
|
7.7 |
|
Total operating expenses |
|
|
125.4 |
|
|
|
153.1 |
|
Loss from operations |
|
|
(25.4 |
) |
|
|
(53.1 |
) |
Other income (expense), net |
|
|
9.8 |
|
|
|
(0.5 |
) |
Loss before provision for income taxes |
|
|
(15.5 |
) |
|
|
(53.6 |
) |
Provision for income taxes |
|
|
1.5 |
|
|
|
2.3 |
|
Net loss |
|
|
(17.1 |
) |
|
|
(56.0 |
) |
Year Ended December 31, 2022 Compared With Year Ended December 31, 2021
Revenue
|
|
Year Ended |
|
|
Year Ended |
|
||||||||||||||||||
|
|
Commercial |
|
|
Government & |
|
|
|
|
|
Commercial |
|
|
Government & |
|
|
|
|
||||||
|
|
Enterprise |
|
|
Regulated |
|
|
Total |
|
|
Enterprise |
|
|
Regulated |
|
|
Total |
|
||||||
Software Products & Services (1) |
|
$ |
80,749 |
|
|
$ |
3,829 |
|
|
$ |
84,578 |
|
|
$ |
55,484 |
|
|
$ |
4,031 |
|
|
$ |
59,515 |
|
Managed Services |
|
|
65,150 |
|
|
|
— |
|
|
|
65,150 |
|
|
|
55,790 |
|
|
|
— |
|
|
|
55,790 |
|
Revenue |
|
$ |
145,899 |
|
|
$ |
3,829 |
|
|
$ |
149,728 |
|
|
$ |
111,274 |
|
|
$ |
4,031 |
|
|
$ |
115,305 |
|
(1) Software Products & Services consists of aiWARE revenues of $27.2 million and $21.2 million for the years ended December 31, 2022 and December 31, 2021, respectively, as well PandoLogic revenues of $57.4 million and $38.3 million for the years ended December 31, 2022 and December 31, 2021, respectively.
Commercial Enterprise
45
Commercial Enterprise Software Products & Services revenue increased $25.3 million, or 46%, in the year ended December 31, 2022 compared to the prior year due primarily to our acquisition of PandoLogic in September 2021, coupled with expanded services we provided to existing media and entertainment customers. Commercial Enterprise Managed Services increased in the year ended December 31, 2022 compared to the prior year due to growth of our licensing platform, in new advertising customers and in expanded services for existing advertising customers and in live events coverage as conditions return to pre-COVID levels.
Government & Regulated Industries
Government & Regulated Industries Software Products & Services revenue decreased $0.2 million, or 5%, in the year ended December 31, 2022 compared to the prior year. Government & Regulated Industries Software Products & Services revenue from customers in certain markets, particularly government, is often project-based and is impacted by the timing of projects. As such, we expect that our revenue from these markets could fluctuate significantly from period to period.
Operating Expenses
(dollars in thousands) |
|
Year Ended |
|
|
|
|
|
|
|
|
|||||||
|
|
2022 |
|
|
2021 |
|
|
$ Change |
|
|
% Change |
|
|
||||
Cost of revenue |
|
$ |
27,432 |
|
|
$ |
22,129 |
|
|
$ |
5,303 |
|
|
|
24.0 |
% |
|
Sales and marketing |
|
|
51,345 |
|
|
|
28,935 |
|
|
|
22,410 |
|
|
|
77.4 |
% |
|
Research and development |
|
|
43,589 |
|
|
|
25,075 |
|
|
|
18,514 |
|
|
|
73.8 |
% |
|
General and administrative |
|
|
44,177 |
|
|
|
91,667 |
|
|
|
(47,490 |
) |
|
|
(51.8 |
)% |
|
Amortization |
|
|
21,180 |
|
|
|
8,872 |
|
|
|
12,308 |
|
|
|
138.7 |
% |
|
Total operating expenses |
|
$ |
187,723 |
|
|
$ |
176,678 |
|
|
$ |
11,045 |
|
|
|
6.3 |
% |
|
Cost of Revenue. The increase in cost of revenue in 2022 compared to 2021 was primarily due to our higher revenue level, as discussed above. As a percentage of revenue, cost of revenue improved to 18.3% in 2022 as compared to 19.2% in 2021 driven by the higher mix of software products and services in 2022, which generally have lower cost of revenues.
Sales and Marketing. The increase in sales and marketing expenses of $22.4 million or 77% in 2022 compared with 2021 was primarily due to an increase of $13.5 million relating to our acquisition of PandoLogic in September 2021, increases in personnel-related costs of $4.2 million from the addition of new sales and marketing resources, and increases in marketing spend of $1.8 million. As a percentage of revenue, sales and marketing expenses increased to 34% in 2022 from 25% in 2021.
Research and Development. The increase in research and development expenses of $18.5 million or 74% in 2022 compared with 2021 was primarily due to an increase of $10.0 million relating to our acquisition of PandoLogic in September 2021 and increases in personnel-related costs of $10.3 million from the addition of new engineering resources to support our growth and continued investment in our aiWARE platform, partially offset by an increase in internal use capitalized software development costs. As a percentage of revenue, research and development expenses increased to 29% in 2022 from 22% in 2021.
General and Administrative. General and administrative expenses decreased $47.5 million or 52% in 2022 compared to 2021 principally due to a $34.8 million decrease in the estimated fair value of contingent consideration associated with acquisitions, a $24.8 million decrease in stock compensation expense attributable primarily to additional expense related to the vesting of performance-based stock options in 2021, and a $3.4 million one-time charge related to the sublease of our former Costa Mesa corporate office space in the first quarter of 2021, partially offset by an increase of $6.9 million relating to our acquisition of PandoLogic in September 2021, and increases in personnel-related costs of $4.7 million from the addition of new resources. As a percentage of revenue, general and administrative expenses declined to 30% in 2022 from 80% in 2021.
46
Amortization. Amortization expense increased in 2022 compared with the corresponding prior year period due to the addition of amortization expense related to our PandoLogic acquisition and our 2022 acquisitions.
Other Income, Net
Other income, net for 2022 was comprised primarily of a net gain on debt extinguishment of $19.1 million, partially offset by interest expense, net of $1.2 due primarily to the Convertible Notes we issued in November 2021.
Non-GAAP Gross Profit
For the year ended December 31, 2022, our total loss from operations decreased to $38.0 million compared to $61.4 for the year ended December 31, 2021. As noted above, our non-GAAP gross profit is calculated as our revenue less our cost of revenue, as follows:
(dollars in thousands) |
|
Year Ended |
|
|
|
|
|
|
|
|
|||||||
|
|
2022 |
|
|
2021 |
|
|
$ Change |
|
|
% Change |
|
|
||||
Revenue |
|
$ |
149,728 |
|
|
$ |
115,305 |
|
|
$ |
34,423 |
|
|
|
29.9 |
% |
|
Cost of revenue |
|
|
27,432 |
|
|
|
22,129 |
|
|
|
5,303 |
|
|
|
24.0 |
% |
|
Non-GAAP gross profit |
|
|
122,296 |
|
|
|
93,176 |
|
|
|
29,120 |
|
|
|
31.3 |
% |
|
Non-GAAP gross margin |
|
|
81.7 |
% |
|
|
80.8 |
% |
|
|
|
|
|
|
|
||
The increase in non-GAAP gross profit and non-GAAP gross margin in the year ended December 31, 2022 compared with the prior year was due primarily to growth in Software Products & Services revenue, including a full year of hiring solutions revenue in our 2022 results.
Liquidity and Capital Resources
We have historically financed our business through the sale of equity and debt securities. Our principal sources of liquidity are our cash and cash equivalents, which totaled $184.4 million as of December 31, 2022, compared with total cash and cash equivalents of $254.7 million as of December 31, 2021. The decrease in our cash and cash equivalents as of December 31, 2022 as compared with December 31, 2021 was primarily due to the $39.0 million repurchase of a portion of our outstanding Convertible Notes in December 2022, investments and acquisitions made during the year ended December 31, 2022, taxes paid related to net share settlement of equity awards, and the payment of the 2021 PandoLogic Earnout, offset slightly by cash proceeds of $3.7 million from operating activities in the year ended December 31, 2022.
Cash Flows
A summary of cash flows from our operating, investing and financing activities is shown in the table below.
(in thousands) |
|
Year Ended |
|
|||||
|
|
2022 |
|
|
2021 |
|
||
Cash provided by operating activities |
|
$ |
3,737 |
|
|
$ |
7,234 |
|
Cash used in investing activities |
|
|
(12,104 |
) |
|
|
(53,843 |
) |
Cash (used in) provided by financing activities |
|
|
(61,928 |
) |
|
|
186,514 |
|
Net (decrease) increase in cash, cash equivalents and restricted cash |
|
$ |
(70,295 |
) |
|
$ |
139,905 |
|
Cash Provided By Operating Activities
Our operating activities generated cash inflows of $3.7 million in the year ended December 31, 2022, due primarily to our net loss of $25.6 million, adjusted by $1.0 million in non-cash expenses, including $22.5 million in depreciation and amortization and $19.3 million in stock-based compensation expense, offset in part by $22.7 million from a change in the fair value of contingent consideration and a $19.1 million net gain on debt extinguishment, with an additional $28.2 million and from the net working capital increase primarily due to a decrease in accounts receivable of $29.7 million.
47
Our operating activities provided cash of $7.2 million in 2021, primarily due to a net increase of $31.0 million in cash received from advertising customers for future payments to vendors, offset by the effect of our net loss of $70.6 million, adjusted by $70.7 million in non-cash expenses, including $40.1 million in stock-based compensation expense and $18.3 million in change in the fair value of contingent consideration.
Cash Used in Investing Activities
Our investing activities for the year ended December 31, 2022 used cash of $12.1 million primarily for $4.8 million in capital expenditures, $4.6 million to fund a portion of the consideration for our acquisitions, and for an equity investment of $2.8 million in a strategic partner.
In 2021, our investing activities used cash of $53.8 million, primarily to fund a portion of the consideration for the acquisition of PandoLogic.
Cash Provided by Financing Activities
Our financing activities for the year ended December 31, 2022 used cash of $61.9 million, consisting of $39.0 million to pay for the repurchase of a portion of our outstanding Convertible Notes, $14.4 million to pay the 2021 earnout for PandoLogic and $9.8 million to pay taxes paid related to the net share settlement of equity awards, partially offset by $1.3 million in proceeds received from the exercise of stock options and purchases of shares under our ESPP.
Our financing activities provided cash of $186.5 million in 2021. Net cash provided by financing activities consisted of $201.3 million in gross proceeds from the sale of the Convertible Notes, $7.9 million received from the exercise of stock options and purchases of shares under our ESPP and $2.3 million in proceeds received from the exercise of stock warrants, partially offset by a use of $18.6 million to fund the capped call transactions related to the Convertible Notes and a use of $6.3 million in debt issuance costs for the Convertible Notes.
Contractual Obligations and Known Future Cash Requirements
As of December 31, 2022, our only debt obligations were the Convertible Notes issued in the fourth quarter of fiscal year 2021, net of amounts repurchased in 2022. The remaining principal on the Convertible Notes of $141.25 million will mature on November 15, 2026, unless earlier converted, redeemed or repurchased in accordance with the terms of the Convertible Notes.
As of December 31, 2022, we have future cash requirements to pay the PandoLogic Earnout amount for 2022 of $10.8 million in a combination of cash and stock in the first quarter of 2023 and to pay $5.3 million in purchase consideration commitments related to the VSL acquisition, the VocaliD acquisition, and the March 2022 acquisition that will be paid in 2023 and in 2024. We have no other present agreements or commitments with respect to any material acquisitions of businesses or technologies or any other material capital expenditures.
We have generated significant losses since inception; however, we do expect to begin generating profits in the foreseeable future. We believe that our current cash and cash equivalents balance will be sufficient to fund our operations in the ordinary course of business for at least the next twelve months from the date of this filing. We have not entered into any off-balance sheet arrangements.
Item 7A. Quantitative and Qualitative Disclosures About Market Risk.
As a smaller reporting company, we are not required to provide the information required by Item 305 of Regulation S-K.
48
Item 8. Financial Statements and Supplementary Data
INDEX TO FINANCIAL STATEMENTS
Reports of Independent Registered Public Accounting Firm (Grant Thornton LLP; Newport Beach, CA; PCAOB ID Number |
50 |
54 |
|
Consolidated Statements of Operations and Comprehensive Loss |
55 |
56 |
|
57 |
|
59 |
49
REPORT OF INDEPENDENT REGISTERED PUBLIC ACCOUNTING FIRM
Board of Directors and Stockholders
Veritone, Inc.
Opinion on the financial statements
We have audited the accompanying consolidated balance sheets of Veritone, Inc. (a Delaware corporation) and subsidiaries (the “Company”) as of December 31, 2022 and 2021, the related consolidated statements of operations and comprehensive loss, stockholders’ equity (deficit), and cash flows for each of the two years in the period ended December 31, 2022, and the related notes (collectively referred to as the “financial statements”). In our opinion, the financial statements present fairly, in all material respects, the financial position of the Company as of December 31, 2022 and 2021, and the results of its operations and its cash flows for each of the two years in the period ended December 31, 2022, in conformity with accounting principles generally accepted in the United States of America.
We also have audited, in accordance with the standards of the Public Company Accounting Oversight Board (United States) (“PCAOB”), the Company’s internal control over financial reporting as of December 31, 2022, based on criteria established in the 2013 Internal Control—Integrated Framework issued by the Committee of Sponsoring Organizations of the Treadway Commission (“COSO”), and our report dated March 16, 2023 expressed an adverse opinion.
Basis for opinion
These financial statements are the responsibility of the Company’s management. Our responsibility is to express an opinion on the Company’s financial statements based on our audits. We are a public accounting firm registered with the PCAOB and are required to be independent with respect to the Company in accordance with the U.S. federal securities laws and the applicable rules and regulations of the Securities and Exchange Commission and the PCAOB.
We conducted our audits in accordance with the standards of the PCAOB. Those standards require that we plan and perform the audit to obtain reasonable assurance about whether the financial statements are free of material misstatement, whether due to error or fraud. Our audits included performing procedures to assess the risks of material misstatement of the financial statements, whether due to error or fraud, and performing procedures that respond to those risks. Such procedures included examining, on a test basis, evidence regarding the amounts and disclosures in the financial statements. Our audits also included evaluating the accounting principles used and significant estimates made by management, as well as evaluating the overall presentation of the financial statements. We believe that our audits provide a reasonable basis for our opinion.
Critical audit matter
The critical audit matter communicated below is a matter arising from the current period audit of the financial statements that was communicated or required to be communicated to the audit committee and that: (1) relates to accounts or disclosures that are material to the financial statements and (2) involved our especially challenging, subjective, or complex judgments. The communication of critical audit matters does not alter in any way our opinion on the financial statements, taken as a whole, and we are not, by communicating the critical audit matter below, providing a separate opinion on the critical audit matter or on the accounts or disclosures to which it relates.
Realizability of Trade Credits
As described further in note 2 to the financial statements, the Company provides software as barter transactions in exchange for other assets, such as trade credits, in the ordinary course of business. Adjustments are made to reduce the trade credits to their net realizable value. Management monitors trade credit usage and evaluates the need for potential write-downs for estimated trade credits that are expected to remain unused prior to their expiration based on forecasted usage. We identified the realizability of the trade credits as a critical audit matter.
The principal consideration for our determination that the realizability of trade credits is a critical audit matter is that the assessment of the valuation of the trade credits includes an estimate of forecasted usage. The usage estimate is subjective and requires the Company to consider significant assumptions such as economic conditions and estimates of spend, which are subject to significant uncertainty and therefore require significant auditor judgement.
Our audit procedures related to the realizability of trade credits included the following, among others.
50
/s/
We have served as the Company’s auditor since 2018.
March 16, 2023
51
REPORT OF INDEPENDENT REGISTERED PUBLIC ACCOUNTING FIRM
Board of Directors and Stockholders
Veritone, Inc.
Opinion on the internal control over financial reporting
We have audited the internal control over financial reporting of Veritone, Inc. (a Delaware corporation) and subsidiaries (the “Company”) as of December 31, 2022, based on criteria established in the 2013 Internal Control—Integrated Framework issued by the Committee of Sponsoring Organizations of the Treadway Commission (“COSO”). In our opinion, because of the effect of the material weakness described in the following paragraphs on the achievement of the objectives of the control criteria, the Company has not maintained effective internal control over financial reporting as of December 31, 2022, based on criteria established in the 2013 Internal Control—Integrated Framework issued by COSO.
A material weakness is a deficiency, or combination of control deficiencies, in internal control over financial reporting, such that there is a reasonable possibility that a material misstatement of the company’s annual or interim financial statements will not be prevented or detected on a timely basis. The following material weakness has been identified and included in management’s assessment.
There were ineffective information technology general controls (“ITGCs”) in the areas of user access and change-management over certain information technology systems that support the Company’s financial reporting processes. In addition, the Company’s business process automated and manual controls that are dependent on the affected ITGCs were also deemed ineffective because they could have been adversely impacted. We also have audited, in accordance with the standards of the Public Company Accounting Oversight Board (United States) (“PCAOB”), the consolidated financial statements of the Company as of and for the year ended December 31, 2022. The material weakness identified above was considered in determining the nature, timing, and extent of audit tests applied in our audit of the 2022 consolidated financial statements, and this report does not affect our report dated March 16, 2023 which expressed an unqualified opinion on those financial statements.
Basis for opinion
The Company’s management is responsible for maintaining effective internal control over financial reporting and for its assessment of the effectiveness of internal control over financial reporting, included in the accompanying Management's Annual Report on Internal Control Over Financial Reporting. Our responsibility is to express an opinion on the Company’s internal control over financial reporting based on our audit. We are a public accounting firm registered with the PCAOB and are required to be independent with respect to the Company in accordance with the U.S. federal securities laws and the applicable rules and regulations of the Securities and Exchange Commission and the PCAOB.
We conducted our audit in accordance with the standards of the PCAOB. Those standards require that we plan and perform the audit to obtain reasonable assurance about whether effective internal control over financial reporting was maintained in all material respects. Our audit included obtaining an understanding of internal control over financial reporting, assessing the risk that a material weakness exists, testing and evaluating the design and operating effectiveness of internal control based on the assessed risk, and performing such other procedures as we considered necessary in the circumstances. We believe that our audit provides a reasonable basis for our opinion.
Definition and limitations of internal control over financial reporting
A company’s internal control over financial reporting is a process designed to provide reasonable assurance regarding the reliability of financial reporting and the preparation of financial statements for external purposes in accordance with generally accepted accounting principles. A company’s internal control over financial reporting includes those policies and procedures that (1) pertain to the maintenance of records that, in reasonable detail, accurately and fairly reflect the transactions and dispositions of the assets of the company; (2) provide reasonable assurance that transactions are recorded as necessary to permit preparation of financial statements in accordance with generally accepted accounting principles, and that receipts and expenditures of the company are being made only in accordance with authorizations of management and directors of the company; and (3) provide reasonable assurance regarding prevention or timely detection of unauthorized acquisition, use, or disposition of the company’s assets that could have a material effect on the financial statements.
52
Because of its inherent limitations, internal control over financial reporting may not prevent or detect misstatements. Also, projections of any evaluation of effectiveness to future periods are subject to the risk that controls may become inadequate because of changes in conditions, or that the degree of compliance with the policies or procedures may deteriorate.
/s/ GRANT THORNTON LLP
Newport Beach, California
March 16, 2023
53
VERITONE, INC.
CONSOLIDATED BALANCE SHEETS
(in thousands, except per share and share data)
|
|
As of |
|
|||||
|
|
December 31, |
|
|
December 31, |
|
||
ASSETS |
|
|
|
|
|
|
||
Cash and cash equivalents |
|
$ |
|
|
$ |
|
||
Accounts receivable, net |
|
|
|
|
|
|
||
Expenditures billable to clients |
|
|
|
|
|
|
||
Prepaid expenses and other current assets |
|
|
|
|
|
|
||
Total current assets |
|
|
|
|
|
|
||
Property, equipment and improvements, net |
|
|
|
|
|
|
||
Intangible assets, net |
|
|
|
|
|
|
||
Goodwill |
|
|
|
|
|
|
||
Long-term restricted cash |
|
|
|
|
|
|
||
Other assets |
|
|
|
|
|
|
||
Total assets |
|
$ |
|
|
$ |
|
||
LIABILITIES AND STOCKHOLDERS' EQUITY |
|
|
|
|
|
|
||
Accounts payable |
|
$ |
|
|
$ |
|
||
Accrued media payments |
|
|
|
|
|
|
||
Client advances |
|
|
|
|
|
|
||
Contingent consideration, current |
|
|
|
|
|
|
||
Other accrued liabilities |
|
|
|
|
|
|
||
Total current liabilities |
|
|
|
|
|
|
||
Convertible senior notes, non-current |
|
|
|
|
|
|
||
Contingent consideration, non-current |
|
|
— |
|
|
|
|
|
Other non-current liabilities |
|
|
|
|
|
|
||
Total liabilities |
|
|
|
|
|
|
||
|
|
|
|
|
|
|||
Stockholders' equity |
|
|
|
|
|
|
||
Common stock, par value $ |
|
|
|
|
|
|
||
Additional paid-in capital |
|
|
|
|
|
|
||
Accumulated deficit |
|
|
( |
) |
|
|
( |
) |
Accumulated other comprehensive income (loss) |
|
|
( |
) |
|
|
( |
) |
Total stockholders' equity |
|
|
|
|
|
|
||
Total liabilities and stockholders' equity |
|
$ |
|
|
$ |
|
||
The accompanying notes are an integral part of these consolidated financial statements.
54
VERITONE, INC.
CONSOLIDATED STATEMENTS OF OPERATIONS AND COMPREHENSIVE LOSS
(in thousands, except per share and share data)
|
|
Year Ended |
|
|||||
|
|
2022 |
|
|
2021 |
|
||
Revenue |
|
$ |
|
|
$ |
|
||
Operating expenses: |
|
|
|
|
|
|
||
Cost of revenue |
|
|
|
|
|
|
||
Sales and marketing |
|
|
|
|
|
|
||
Research and development |
|
|
|
|
|
|
||
General and administrative |
|
|
|
|
|
|
||
Amortization |
|
|
|
|
|
|
||
Total operating expenses |
|
|
|
|
|
|
||
Loss from operations |
|
|
( |
) |
|
|
( |
) |
Other income (expense), net |
|
|
|
|
|
( |
) |
|
Loss before provision for income taxes |
|
|
( |
) |
|
|
( |
) |
Provision for income taxes |
|
|
|
|
|
|
||
Net loss |
|
$ |
( |
) |
|
$ |
( |
) |
Net loss per share: |
|
|
|
|
|
|
||
Basic and diluted |
|
$ |
( |
) |
|
$ |
( |
) |
Weighted average shares outstanding: |
|
|
|
|
|
|
||
Basic and diluted |
|
|
|
|
|
|
||
Comprehensive loss: |
|
|
|
|
|
|
||
Net loss |
|
$ |
( |
) |
|
$ |
( |
) |
Foreign currency translation gain (loss), net of income taxes |
|
|
|
|
|
( |
) |
|
Total comprehensive loss |
|
$ |
( |
) |
|
$ |
( |
) |
The accompanying notes are an integral part of these consolidated financial statements.
55
VERITONE, INC.
CONSOLIDATED STATEMENTS OF STOCKHOLDERS’ EQUITY (DEFICIT)
(in thousands, except share data)
|
|
|
|
|||||||||||||||||||||
|
|
|
|
|
|
|
|
|
|
|
Accumulated |
|
|
|
|
|||||||||
|
|
|
|
|
|
|
|
Additional |
|
|
|
|
|
Other |
|
|
|
|
||||||
|
|
Common Stock |
|
|
Paid-in |
|
|
Accumulated |
|
|
Comprehensive |
|
|
|
|
|||||||||
|
|
Shares |
|
|
Amount |
|
|
Capital |
|
|
Deficit |
|
|
Income (Loss) |
|
|
Total |
|
||||||
Balance as of December 31, 2020 |
|
|
|
|
$ |
|
|
$ |
|
|
$ |
( |
) |
|
$ |
|
|
$ |
|
|||||
Common stock issued under employee stock plans, net |
|
|
|
|
|
|
|
|
|
|
|
— |
|
|
|
— |
|
|
|
|
||||
Common stock issued for acquisition |
|
|
|
|
|
|
|
|
|
|
|
— |
|
|
|
— |
|
|
|
|
||||
Common stock issued for services |
|
|
|
|
|
— |
|
|
|
|
|
|
— |
|
|
|
— |
|
|
|
|
|||
Stock-based compensation |
|
|
— |
|
|
|
— |
|
|
|
|
|
|
— |
|
|
|
— |
|
|
|
|
||
Exercise of warrants |
|
|
|
|
|
— |
|
|
|
|
|
|
— |
|
|
|
— |
|
|
|
|
|||
Purchases of capped calls related to convertible notes |
|
|
— |
|
|
|
— |
|
|
|
( |
) |
|
|
— |
|
|
|
— |
|
|
|
( |
) |
Net loss |
|
|
— |
|
|
|
— |
|
|
|
— |
|
|
|
( |
) |
|
|
— |
|
|
|
( |
) |
Other comprehensive loss |
|
|
— |
|
|
|
— |
|
|
|
— |
|
|
|
— |
|
|
|
( |
) |
|
|
( |
) |
Balance as of December 31, 2021 |
|
|
|
|
|
|
|
|
|
|
|
( |
) |
|
|
( |
) |
|
|
|
||||
Cumulative-effect of accounting change adopted as of January 1, 2022 |
|
|
— |
|
|
|
— |
|
|
|
— |
|
|
|
( |
) |
|
|
— |
|
|
|
( |
) |
Common stock issued under employee stock plans, net |
|
|
|
|
|
|
|
|
|
|
|
— |
|
|
|
— |
|
|
|
|
||||
Common stock withheld for employee taxes |
|
|
( |
) |
|
|
— |
|
|
|
( |
) |
|
|
— |
|
|
|
— |
|
|
|
( |
) |
Common stock issued for acquisitions |
|
|
|
|
|
— |
|
|
|
|
|
|
— |
|
|
|
— |
|
|
|
|
|||
Common stock issued as part of contingent consideration |
|
|
|
|
|
— |
|
|
|
|
|
|
— |
|
|
|
— |
|
|
|
|
|||
Stock-based compensation |
|
|
— |
|
|
|
— |
|
|
|
|
|
|
— |
|
|
|
— |
|
|
|
|
||
Unwinding of capped calls related to convertible notes repurchase |
|
|
— |
|
|
|
— |
|
|
|
|
|
|
— |
|
|
|
— |
|
|
|
|
||
Net loss |
|
|
— |
|
|
|
— |
|
|
|
— |
|
|
|
( |
) |
|
|
— |
|
|
|
( |
) |
Other comprehensive loss |
|
|
— |
|
|
|
— |
|
|
|
— |
|
|
|
— |
|
|
|
|
|
|
|
||
Balance as of December 31, 2022 |
|
|
|
|
$ |
|
|
$ |
|
|
$ |
( | ) |
|
$ |
( |
) |
|
$ |
|
||||
|
|
|
|
|
|
|
|
|
|
|
|
|
|
|
|
|
|
|
||||||
The accompanying notes are an integral part of these consolidated financial statements.
56
VERITONE, INC.
CONSOLIDATED STATEMENTS OF CASH FLOWS
(in thousands)
|
|
Year Ended |
|
|||||
|
|
2022 |
|
|
2021 |
|
||
Cash flows from operating activities: |
|
|
|
|
|
|
||
Net loss |
|
$ |
( |
) |
|
$ |
( |
) |
Adjustments to reconcile net loss to net cash provided by operating activities: |
|
|
|
|
|
|
||
Depreciation and amortization |
|
|
|
|
|
|
||
Loss on disposal of fixed assets |
|
|
— |
|
|
|
|
|
Provision for doubtful accounts |
|
|
|
|
|
|
||
Loss on sublease |
|
|
— |
|
|
|
|
|
Stock-based compensation expense |
|
|
|
|
|
|
||
Change in fair value of contingent consideration |
|
|
( |
) |
|
|
|
|
Change in deferred taxes |
|
|
( |
) |
|
|
( |
) |
Amortization of debt issuance costs |
|
|
|
|
|
— |
|
|
Amortization of right-of-use assets |
|
|
|
|
|
— |
|
|
Gain on debt extinguishment |
|
|
( |
) |
|
|
— |
|
Changes in assets and liabilities: |
|
|
|
|
|
|
||
Accounts receivable |
|
|
|
|
|
( |
) |
|
Expenditures billable to clients |
|
|
|
|
|
( |
) |
|
Prepaid expenses and other assets |
|
|
( |
) |
|
|
|
|
Other assets |
|
|
( |
) |
|
|
( |
) |
Accounts payable |
|
|
( |
) |
|
|
|
|
Accrued media payments |
|
|
|
|
|
|
||
Client advances |
|
|
|
|
|
|
||
Other accrued liabilities |
|
|
( |
) |
|
|
|
|
Other liabilities |
|
|
( |
) |
|
|
( |
) |
Net cash provided by operating activities |
|
|
|
|
|
|
||
Cash flows from investing activities: |
|
|
|
|
|
|
||
Minority investment |
|
|
( |
) |
|
|
— |
|
Capital expenditures |
|
|
( |
) |
|
|
( |
) |
Acquisitions, net of cash acquired |
|
|
( |
) |
|
|
( |
) |
Net cash used in investing activities |
|
|
( |
) |
|
|
( |
) |
Cash flows from financing activities: |
|
|
|
|
|
|
||
Proceeds from issuance of convertible senior notes |
|
|
— |
|
|
|
|
|
Payment of debt issuance costs |
|
|
— |
|
|
|
( |
) |
Purchases of capped calls related to convertible senior notes |
|
|
— |
|
|
|
( |
) |
Repurchase of convertible senior notes |
|
|
( |
) |
|
|
— |
|
Payment of debt repurchase costs |
|
|
( |
) |
|
|
— |
|
Unwinding of capped calls related to debt repurchase |
|
|
|
|
|
— |
|
|
Payment of contingent considerations |
|
|
( |
) |
|
|
— |
|
Taxes paid related to net share settlement of equity awards |
|
|
( |
) |
|
|
— |
|
Proceeds from the exercise of warrants |
|
|
— |
|
|
|
|
|
Proceeds from issuances of stock under employee stock plans, net |
|
|
|
|
|
|
||
Net cash (used in) provided by financing activities |
|
|
( |
) |
|
|
|
|
Net (decrease) increase in cash and cash equivalents and restricted cash |
|
|
( |
) |
|
|
|
|
Cash and cash equivalents and restricted cash, beginning of period |
|
|
|
|
|
|
||
Cash and cash equivalents and restricted cash, end of period |
|
$ |
|
|
$ |
|
||
Supplemental Disclosure of Cash Flow Information |
|
|
|
|
|
|
||
Cash paid during the period for: |
|
|
|
|
|
|
||
Taxes paid |
|
$ |
|
|
$ |
|
||
Interest paid |
|
$ |
|
|
$ |
— |
|
|
Non-cash investing and financing activities: |
|
|
|
|
|
|
||
Shares issued for acquisition of businesses and earn-out consideration |
|
$ |
|
|
$ |
|
||
Stock-based compensation capitalized for software development |
|
$ |
|
|
$ |
|
||
Lease liabilities arising from right-of-use assets |
|
$ |
|
|
$ |
— |
|
|
57
The accompanying notes are an integral part of these consolidated financial statements.
58
VERITONE, INC.
NOTES TO CONSOLIDATED FINANCIAL STATEMENTS
(in thousands, except share and per share data and percentages)
NOTE 1. DESCRIPTION OF BUSINESS
Veritone, Inc., a Delaware corporation (together with its subsidiaries, collectively, the “Company”), is a provider of artificial intelligence (“AI”) computing solutions. The Company’s proprietary AI operating system, aiWARETM, uses machine learning algorithms, or AI models, together with a suite of powerful applications, to reveal valuable insights from vast amounts of structured and unstructured data. The aiWARE platform offers capabilities that mimic human cognitive functions such as perception, prediction and problem solving, enabling users to quickly, efficiently and cost effectively transform unstructured data into structured data, and analyze and optimize data to drive business processes and insights. aiWARE is based on an open architecture that enables new AI models, applications and workflows to be added quickly and efficiently, resulting in a scalable and evolving solution that can be leveraged by organizations across a broad range of business sectors, serving commercial enterprises as well as government and regulated industries.
In addition, the Company operates a full-service advertising agency that leverages the Company’s aiWARE technologies to provide differentiated Managed Services to its clients. The Company’s advertising services include media planning and strategy, advertisement buying and placement, campaign messaging, clearance verification and attribution, and custom analytics, specializing in host-endorsed and influencer advertising across primarily radio, podcasting, streaming audio, social media and other digital media channels. The Company’s advertising services also include its VeriAds Network, which is comprised of programs that enable broadcasters, podcasters and social media influencers to generate incremental advertising revenue. The Company also offers cloud-native digital content management solutions and licensing services, primarily to customers in the media and entertainment market. These offerings leverage the Company’s aiWARE technologies, providing customers with unique capabilities to enrich and drive expanded revenue opportunities from their content.
On August 11, 2022, the Company acquired certain assets of Vision Semantics Limited (“VSL”), a U.K.-based company focused on AI-powered video analytics and surveillance software solutions. On June 10, 2022, the Company acquired VocaliD, Inc. (“VocaliD”), a U.S.-based company that pioneered the creation of personalized synthetic voices. On March 1, 2022, the Company acquired an influencer-based management company. On September 14, 2021, the Company acquired PandoLogic Ltd. (“PandoLogic”), a company incorporated under the laws of the state of Israel, and a leading provider of intelligent hiring solutions. PandoLogic’s software platform, PandoIQ, is an AI-enabled talent acquisition and recruitment platform. For further details on these acquisitions, refer to Note 3.
NOTE 2. PRESENTATION AND SUMMARY OF SIGNIFICANT ACCOUNTING POLICIES
Basis of Presentation
The accompanying consolidated financial statements have been prepared in accordance with generally accepted accounting principles in the United States of America (“GAAP”) and the rules and regulations of the Securities and Exchange Commission (the “SEC”). The consolidated financial statements include the accounts of the Company. All intercompany accounts and transactions have been eliminated in consolidation.
Adjustment of Previously Issued Financial Statements
The Company evaluated the aggregate effects of an error related to the calculation of fair value of contingent consideration at the time of the acquisition of PandoLogic, which led to an understatement of goodwill, intangible assets and contingent consideration at the time of the acquisition, an overstatement of subsequent changes to the fair value of contingent consideration, and an understatement of subsequent intangible amortization expense to its previously issued financial statements in accordance with SEC Staff Accounting Bulletins No. 99 and No. 108. Based upon quantitative and qualitative factors, the Company determined that the errors were not material to the previously issued financial statements included in its Annual Report on Form 10-K for the year ended December 31, 2021 or for any quarterly periods included therein.
The following tables reflect the impact of the adjustments to the specific line items presented in the Company’s previously reported consolidated financial statements as of and for the year-ended December 31, 2021 (in thousands, except per share amounts):
59
Consolidated Balance Sheet
|
|
As of December 31, 2021 |
|
|||||||||
|
|
As Reported |
|
|
Adjustment |
|
|
As Adjusted |
|
|||
Intangible assets, net |
|
$ |
|
|
$ |
|
|
$ |
|
|||
Goodwill |
|
|
|
|
|
|
|
|
|
|||
Total assets |
|
|
|
|
|
|
|
|
|
|||
Contingent consideration, current |
|
|
|
|
|
|
|
|
|
|||
Total current liabilities |
|
|
|
|
|
|
|
|
|
|||
Contingent consideration, non-current |
|
|
|
|
|
|
|
|
|
|||
Other non-current liabilities |
|
|
|
|
|
|
|
|
|
|||
Total liabilities |
|
|
|
|
|
|
|
|
|
|||
Accumulated deficit |
|
|
( |
) |
|
|
|
|
|
( |
) |
|
Total stockholders' equity |
|
|
|
|
|
|
|
|
|
|||
Total liabilities and stockholders' equity |
|
|
|
|
|
|
|
|
|
|||
Consolidated Statement of Operations and Comprehensive Loss
|
|
Year Ended |
|
|||||||||
|
|
December 31, 2021 |
|
|||||||||
|
|
As Reported |
|
|
Adjustment |
|
|
As Adjusted |
|
|||
General and administrative |
|
$ |
|
|
$ |
( |
) |
|
$ |
|
||
Amortization |
|
|
|
|
|
|
|
|
|
|||
Total operating expenses |
|
|
|
|
|
( |
) |
|
|
|
||
Loss from operations |
|
|
( |
) |
|
|
|
|
|
( |
) |
|
Loss before provision for income taxes |
|
|
( |
) |
|
|
|
|
|
( |
) |
|
Provision for income taxes |
|
|
|
|
|
( |
) |
|
|
|
||
Net loss |
|
|
( |
) |
|
|
|
|
|
( |
) |
|
Basic and diluted net loss per share |
|
|
( |
) |
|
|
|
|
|
( |
) |
|
Total comprehensive loss |
|
|
( |
) |
|
|
|
|
|
( |
) |
|
Consolidated Statement of Stockholders’ Equity
|
|
Accumulated Deficit |
|
|||||||||
|
|
As Reported |
|
|
Adjustment |
|
|
As Adjusted |
|
|||
Net loss |
|
$ |
( |
) |
|
$ |
|
|
$ |
( |
) |
|
Balance as of December 31, 2021 |
|
|
( |
) |
|
|
|
|
|
( |
) |
|
|
Total Stockholders' Equity |
|
||||||||||
Net loss |
|
|
( |
) |
|
|
|
|
|
( |
) |
|
Balance as of December 31, 2021 |
|
|
|
|
|
|
|
|
|
|||
Consolidated Statement of Cash Flows
|
|
Year Ended |
|
|||||||||
|
|
December 31, 2021 |
|
|||||||||
|
|
As Reported |
|
|
Adjustment |
|
|
As Adjusted |
|
|||
Cash flows from operating activities: |
|
|
|
|
|
|
|
|
|
|||
Net loss |
|
$ |
( |
) |
|
$ |
|
|
$ |
( |
) |
|
Adjustments to reconcile net loss to net cash provided by operating activities: |
|
|
|
|
|
|
|
|
|
|||
Depreciation and amortization |
|
|
|
|
|
|
|
|
|
|||
Change in fair value of contingent consideration |
|
|
|
|
|
( |
) |
|
|
|
||
Change in deferred taxes |
|
|
— |
|
|
|
( |
) |
|
|
( |
) |
There was no impact on cash flows from investing or financing activities.
The accompanying applicable Notes to the Consolidated Financial Statements have been updated to reflect the revision for the year ended December 31, 2021.
60
Liquidity and Capital Resources
During 2022 and 2021, the Company generated cash flows from operations of $
61
Management believes that the Company’s existing balances of cash and cash equivalents, which totaled $
Use of Accounting Estimates
The preparation of the accompanying consolidated financial statements in conformity with GAAP requires management to make estimates and assumptions that affect the reported amounts of assets and liabilities and disclosure of contingent assets and liabilities as of the date of the accompanying consolidated financial statements and the reported amounts of revenue and expenses during the reporting period. The principal estimates relate to the accounting recognition and presentation of revenue, allowance for doubtful accounts, purchase accounting, impairment of long-lived assets, the valuation of contingent consideration, the valuation of non-cash consideration received in barter transactions and evaluation of realizability, the valuation of stock awards and stock warrants and income taxes, where applicable.
There has been uncertainty and disruption in the global economy and financial markets due to the COVID-19 pandemic. The Company is not aware of any specific event or circumstance that would require an update to its estimates or assumptions or a revision of the carrying value of its assets or liabilities as of the date of filing of this Annual Report on Form 10-K.
These estimates and assumptions may change as new events occur and additional information is obtained. As a result, actual results could differ materially from these estimates and assumptions.
Business Combinations
The results of a business acquired in a business combination are included in the Company’s consolidated financial statements from the date of the acquisition. Purchase accounting results in assets and liabilities of an acquired business generally being recorded at their estimated fair values as of the acquisition date. Any excess consideration over the fair value of assets acquired and liabilities assumed is recognized as goodwill.
Transaction costs associated with business combinations are expensed as incurred and are included in general and administrative expenses in the consolidated statements of operations and comprehensive loss.
The Company performs valuations of assets acquired and liabilities assumed and allocates the purchase price to its respective assets and liabilities. Determining the fair value of assets acquired and liabilities assumed may require management to use significant judgment and estimates, including the selection of valuation methodologies, estimates of future revenues, costs and cash flows, discount rates, and selection of comparable companies. The Company engages the assistance of valuation specialists in concluding on fair value measurements in connection with determining fair values of assets acquired and liabilities assumed in a business combination.
Cash Equivalents
All highly liquid investments with maturities of three months or less at the date of purchase are classified as cash equivalents.
Accounts Receivable and Expenditures Billable to Clients
Accounts receivable consist primarily of amounts due from the Company’s clients and customers under normal trade terms. Allowances for uncollectible accounts are recorded based upon a number of factors that are reviewed by the Company on an ongoing basis, including historical amounts that have been written off, an evaluation of current economic conditions, and an assessment of customer creditworthiness. Judgment is required in assessing the ultimate realization of accounts receivable.
The amounts due from clients based on costs incurred or fees earned that have not yet been billed to advertising clients are reflected as expenditures billable to clients in the accompanying consolidated balance sheets.
Fair Value of Financial Instruments
Fair value is defined as the exchange price that would be received for an asset or paid to transfer a liability (an exit price) in the principal or most advantageous market for the asset or liability in an orderly transaction between market participants on the measurement date. Valuation techniques used to measure fair value must maximize the use of observable inputs and minimize the use of unobservable inputs. The fair value hierarchy, which is based on three levels of inputs, the first two of which are considered observable and the last unobservable, that may be used to measure fair value, is as follows:
62
The Company classifies its cash equivalents within Level 1 of the fair value hierarchy on the basis of valuations based on quoted prices for the specific securities in an active market.
The Company’s stock warrants are categorized as Level 3 within the fair value hierarchy. Stock warrants are recorded within equity in the Company’s consolidated balance sheets as of December 31, 2022 and 2021. The warrants have been recorded at their fair values using a probability weighted expected return model or Black-Scholes-Merton option pricing model. These models incorporate contractual terms and assumptions regarding expected term, risk-free rates and volatility. The value of the Company’s stock warrants would increase if a higher risk-free interest rate was used and would decrease if a lower risk-free interest rate was used. Similarly, a higher volatility assumption would increase the value of the stock warrants, and a lower volatility assumption would decrease the value of the stock warrants. The development and determination of the unobservable inputs for Level 3 fair value measurements and fair value calculations are the responsibility of the Company’s management with the assistance of a third-party valuation specialist.
The Company’s contingent consideration is categorized as Level 3 within the fair value hierarchy. Contingent consideration is recorded within contingent consideration, current and contingent consideration, non-current in the Company’s consolidated balance sheets as of December 31, 2022 and 2021. The contingent consideration for PandoLogic has been recorded at its fair values using a Monte Carlo simulation option pricing framework. These models incorporate contractual terms and assumptions regarding financial forecasts for PandoLogic, discount rates, and volatility of forecasted revenue. The value of the PandoLogic contingent consideration would increase if a lower discount rate was used and would increase if a higher discount rate was used. Similarly, a higher revenue volatility assumption would increase the value of the PandoLogic contingent consideration, and a lower revenue volatility assumption would decrease the value of the PandoLogic contingent consideration. The contingent consideration for the March 2022 Acquisition has been recorded at its fair values using was the expected (probability-weighted) payment based on the likelihood of achieving the financial performance targets. The development and determination of the unobservable inputs for Level 3 fair value measurements and fair value calculations are the responsibility of the Company’s management with the assistance of a third-party valuation specialist.
The Company’s strategic minority investment is categorized as Level 3 within the fair value hierarchy. This investment is recorded at cost within other assets in the Company’s consolidated balance sheets as of December 31, 2022. The Company will monitor this investment to determine whether an other-than-temporary decline in value indicates that impairment charges may be required. The Company will also re-measure its investment if there is an observable transaction in a similar class of security to our investment.
The Company’s other financial instruments consist primarily of cash, accounts receivable and accounts payable. The Company has determined that the carrying values of these financial instruments approximate fair value for the periods presented due to their short-term nature and the relatively stable current interest rate environment.
Long-Term Restricted Cash
Long-term restricted cash consists primarily of collateral required as security for the Company’s corporate credit cards.
Property, Equipment and Improvements
Property, equipment and improvements are stated at cost. Repairs and maintenance to these assets are charged to expense as incurred. Major improvements enhancing the function and/or useful life of the related assets are capitalized. Depreciation and amortization are computed using the straight-line method over the estimated useful lives (or lease term, if shorter) of the related assets. At the time of retirement or disposition of these assets, the cost and accumulated depreciation or amortization are removed from the accounts and any related gains or losses are recorded in the Company’s statements of operations and comprehensive loss.
The useful lives of property, equipment and improvements are as follows:
The Company assesses the recoverability of property, equipment and improvements whenever events or changes in circumstances indicate that their carrying value may not be recoverable.
63
Goodwill and Intangible Assets
Goodwill represents the excess of the purchase price over the fair value of identifiable net assets acquired in business combinations accounted for under the acquisition method. Intangible assets include acquired developed technology, licensed technology, customer relationships, noncompete covenants, and trademarks and tradenames. Intangible assets are amortized on a straight-line basis over the applicable amortization period as set forth below.
The amortization periods for intangible assets are as follows:
Intangible asset amortization expense is recorded in amortization on the consolidated statements of operations and comprehensive loss.
Impairment of Goodwill and Long-Lived Assets
Goodwill is not amortized but instead is tested at least annually for impairment, or more frequently when events or changes in circumstances indicate that goodwill might be impaired. The Company’s annual impairment test is performed during the second quarter. In assessing goodwill impairment, the Company has the option to first assess qualitative factors to determine whether the existence of events or circumstances leads to a determination that the fair value of a reporting unit is less than its carrying amount. The Company’s qualitative assessment of the recoverability of goodwill considers various macro-economic, industry-specific and company-specific factors. These factors include: (i) severe adverse industry or economic trends; (ii) significant company-specific actions, including exiting an activity in conjunction with restructuring of operations; (iii) current, historical or projected deterioration of the Company’s financial performance; or (iv) a sustained decrease in the Company’s market capitalization below its net book value. If, after assessing the totality of events or circumstances, the Company determines it is unlikely that the fair value of such reporting unit is less than its carrying amount, then a quantitative analysis is unnecessary. However, if the Company concludes otherwise, or if it elects to bypass the qualitative analysis, then it is required to perform a quantitative analysis that compares the fair value of the reporting unit with its carrying amount, including goodwill. If the fair value of the reporting unit exceeds its carrying amount, goodwill is not considered impaired; otherwise, a goodwill impairment loss is recognized for the lesser of: (a) the amount that the carrying amount of a reporting unit exceeds its fair value; or (b) the amount of the goodwill allocated to that reporting unit.
The Company reviews long-lived assets to be held and used, other than goodwill, for impairment at least annually, or whenever events or changes in circumstances indicate that the carrying amount may not be recoverable. If an evaluation of recoverability is required, the estimated undiscounted future cash flows directly associated with the asset are compared with the asset’s carrying amount. If the estimated future cash flows from the use of the asset are less than the carrying value, an impairment charge would be recorded to write down the asset to its estimated fair value.
Revenue Recognition
The Company recognizes revenue under its contracts with customers in accordance with ASU 2014-09, Revenue from Contracts with Customers (“Topic 606”). The Company derives its revenues primarily from two sources: (1) Software Products & Services, which are comprised primarily of subscription and related fees from customers for access to and use of the Company’s platforms and associated services delivered as software-as-a-service (“SaaS”) and (2) Managed Services, which are composed of content licensing revenues made up primarily of fees from customers for licenses to third-party content owners’ digital assets and advertising revenues.
The Company recognizes revenue to depict the transfer of control of promised goods or services to customers in an amount that reflects the consideration to which the Company expects to be entitled in exchange for those goods or services. The Company follows a five-step process to determine revenue recognition, as follows:
64
The Company enters into contracts with customers that may include promises to transfer multiple services. The Company evaluates these services to determine whether they represent distinct, separately identifiable performance obligations that should be accounted for separately or as a single performance obligation. For contracts containing multiple performance obligations, to meet the allocation objective of Topic 606, the Company allocates the transaction price to each performance obligation on a relative standalone selling price (“SSP”) basis. The SSP is the price at which the Company would sell a promised service separately to a customer. For certain arrangements, the determinations regarding whether a contract contains multiple performance obligations and, if so, the SSP of each performance obligation, may require judgment by management.
Software Products & Services Revenues
aiWARE Revenues
The Company has agreements with its customers under which it provides customers with access to and use the Company’s aiWARE and digital content management platforms. Under most agreements, the Company provides access to the platform, specified applications and associated data ingestion, hosting and/or processing services, and standard user support. Fees for these services typically take the form of a fixed monthly subscription fee, with certain contracts specifying usage-based fees for data processing services in excess of the data processing services included as part of such subscription services. Fees for excess usage-based data processing services are accounted for as variable consideration. In certain cases, the fixed monthly subscription fee may adjust during each monthly period of the contract based on changes in the monthly volume of services, at the rates established in the contract. These contracts typically have terms ranging from one to three years, with renewal options, and do not contain refund-type provisions. All significant services provided as part of these subscription arrangements are highly interdependent and constitute a single performance obligation comprised of a series of distinct services transferred to the customer in a similar manner throughout the contract term (collectively, the “subscription services”). The fixed subscription fees are recognized as revenue over the contract term using the output method of passage of time, as this best depicts the pattern of control transfer. If a portion of the term of a contract is cancellable, the Company determines the transaction price for, and recognizes revenue ratably over, the non-cancellable portion of the term of the contract. In certain SaaS arrangements with broadcasters, the fees for subscription services are paid by broadcasters with advertising inventory that is provided to and monetized by the Company. The Company recognizes revenue for these arrangements based on the estimated fair value of the advertising inventory.
The Company also makes data processing, storage and transfer services available to customers through its aiWARE and digital content management platforms under usage-based arrangements with no minimum fees, either separately or in addition to subscription services as described above. Fees are charged for actual usage of such services at the rates specified in the contract for each particular service. Each of these distinct services represents an individual performance obligation. When sold in connection with subscription services, the Company considers the allocation guidance of Topic 606.
Variable consideration for usage-based data processing, storage and transfer services is recognized in the month in which it is earned, as the payment terms relate to a specific outcome (amount of data processed, stored or transferred) of delivering the distinct time increment (the month) of services, and represents the fees to which the Company expects to be entitled for providing the services, and allocating the variable fees in this way is consistent with the allocation objective of Topic 606.
The Company also enters into software license agreements with customers under which the Company provides software representing an on-premises deployment of its aiWARE platform or components thereof. Under these license agreements, the customer is responsible for the installation and configuration of the software in the customer-controlled environment. The Company recognizes the license fees as revenue under these agreements at the time that the software is made available by the Company for download by the customer. In certain instances, the Company will provide software under such arrangements as a barter transaction in exchange for services or other assets in the ordinary course of business. The transaction price for these contracts is measured at the estimated fair value of the non-cash consideration received unless this is not reasonably estimable, in which case the consideration is measured based on the standalone selling price of the software promised to the customer. Revenue is recognized on barter transactions when the software is made available by the Company for download by the customer. Barter revenues are included on the Company’s consolidated statements of operations and comprehensive loss within Revenue.
The Company typically invoices its aiWARE SaaS customers for subscription services monthly, for on-premises software at the time the software is made available for download by the customer, and for professional services either
65
monthly or in accordance with an agreed upon invoicing schedule. Invoices are typically due and payable within 30 days following the date of invoice. Amounts that have been invoiced are recorded in revenue or in deferred revenue, depending on whether transfer of control to customers of the promised services has occurred.
Hiring Solutions Revenues
The Company generates revenue primarily from platform services where it provides its customers access to intelligent hiring services, including ad placements on job boards. Revenue is derived from AI-enabled services, which uses software and algorithms to match buyers and sellers of digital job advertising in a technology-driven marketplace. The Company provides the use of its solution to clients to execute digital hiring campaigns at scale, which are typically ordered through monthly purchasing commitments. The Company charges clients a fee based on various performance indicators as outlined in our customer contracts including job advertisements placed, potential job applicants or other outputs of services placed through its platform, which is accounted for as variable consideration. All services provided as part of these arrangements are highly interdependent and constitute a single performance obligation comprised of a series of distinct services transferred to the customer in a similar manner throughout the contract term. Revenue is recognized over time using the input method of cost incurred as platform services are provided during each campaign as this best depicts the transfer of control. The Company determined that it is not a principal in the purchase and sale of job placements in its arrangements, and as a result, reports its revenue on a net basis for solution fees charged to clients. Costs to source applicants are recorded monthly over the period the services are delivered as an offset to revenue.
Managed Services Revenues
Advertising Revenues
The Company’s advertising services consist primarily of placing advertisements for clients with media vendors, including broadcasters, podcasters and digital media providers. Under the most common billing arrangements, the Company bills and collects the gross cost of the advertisement it places, less any discounts negotiated with its client from the media vendor’s standard agency fee. The Company then remits to the media vendor the gross amount less the standard agency fee. The amount billed to the client, less the amount payable to the media vendor, represents the Company’s fees and is recognized as revenue.
All significant services performed by the Company under its contracts with advertising clients in conjunction with media placements, including planning and placing media and verifying that advertisements have aired, represent a single performance obligation as such services are highly interrelated. The Company’s fee, which represents the transaction price, is recognized as revenue at a point in time when the advertisement is aired, which is the point at which the Company has an enforceable right to payment of its fees.
The Company’s clients may be required to make a deposit or prepay the gross costs of advertisements, including the Company’s fees. Such amounts are reflected as accrued media payments on the Company’s consolidated balance sheets until all revenue recognition criteria have been met.
For certain advertising products, we provide advertisers with the opportunity to reach unique ad units and markets. Leveraging our aiWARE platform to programmatically manage clearance, verification and analysis of advertising performance, we create marketable advertising products through the curation of our broadcaster and influencer networks. We receive fees from advertisers or resellers as consideration for combined software and services performed by us. The amount expected to be received from the advertiser or through the reseller represents our fees which are recognized when our services are transferred to the customer. The Company concluded that it is the principal in delivering these products to customers and as a result reports revenue on a gross basis.
Licensing Revenues
The Company has agreements with third-party owners of digital assets pursuant to which the Company licenses those assets to customers and remits royalties to the content owners. In licensing such third-party digital assets, the Company hosts public and private content libraries on the Company’s platform to enable customers to view and search for digital assets to be licensed, establishes and negotiates with customers the scope and term of, and the prices for, licenses to those digital assets, and makes the licensed digital assets available to the end-customers. The Company is considered the principal under most agreements that have this range of services due to obtaining control prior to transfer of the assets, and the Company records the revenue from the customer gross of royalties due to the content owner. In limited cases, the Company does not obtain
66
control prior to transfer of the assets, and accordingly, the Company records revenues net of royalties due to the content owner.
The Company licenses digital assets under (i) individual license agreements, pursuant to which the customer licenses a particular digital asset (or set of digital assets) for a specified license fee, and (ii) bulk license agreements, pursuant to which the customer pays a fixed fee to have access to view and search third-party owners’ content and to license a specified number of minutes of that content in each year over the term of the contracts, which typically range from one to three years, with certain contracts specifying usage-based license fees for additional digital assets that may be licensed by the customer.
Under individual license agreements, the Company has a single performance obligation, which is to make the licensed digital assets available to the customer, generally by download. The Company recognizes the license fees charged for the digital assets as revenue when the licensed digital assets are made available to the customer.
Under bulk license agreements, the Company’s obligations include hosting the content libraries for access and searching by the customer, updating the libraries with new content provided by the content owner, and making assets selected by the customer available for download, throughout the term of the contract. All of these services are highly interdependent and constitute a single performance obligation comprised of a series of distinct services transferred to the customer in a similar manner throughout the contract term. The predominant item in the single performance obligation is a license providing a right to access the content library throughout the license period. For these arrangements, the Company recognizes the total fixed fees under the contract as revenue ratably over the term of the contract as the performance obligation is satisfied, as this best depicts the pattern of control transfer. If the customer selects digital assets in excess of the amount included in the fixed fees under the contract, the Company constrains the variable consideration until the usage occurs and recognizes such usage-based license fees as the digital assets are made available to the customer, consistent with the usage-based royalty accounting of Topic 606.
Gross Versus Net Revenue Recognition
The Company reports revenue on a gross or net basis based on management’s assessment of whether the Company acts as a principal or agent in the transaction. To the extent the Company acts as the principal, revenue is reported on a gross basis, net of any sales tax from customers, when applicable. The determination of whether the Company acts as a principal or an agent in a transaction is based on an evaluation of whether the Company controls the good or service prior to transfer to the customer. The Company has determined that it acts as the principal in providing all of its services with the exception of certain content licensing services, advertising services and hiring solutions, where the Company recognizes its fees on a net basis.
Remaining Performance Obligations
As of December 31, 2022, the aggregate amount of the transaction prices under the Company’s contracts allocated to the Company’s remaining performance obligations was $
Cost of Revenue
Cost of revenue related to the Company’s advertising business consists of production costs relating to advertising content for advertisements placed for clients, and amounts payable to media vendors under revenue sharing arrangements for ad inventory transferred to and monetized by the Company.
Cost of revenue related to the Company’s Software Products & Services consists primarily of fees charged by vendors for cloud infrastructure, computing and storage services and cognitive processing services related to the operation of the Company’s platforms. The Company’s arrangements with cloud infrastructure providers typically require fees that are based on computing time, data storage and transfer volumes, and reserved computing capacity. The Company also pays fees to third-party providers of AI models, which are generally based upon the hours of media processed through their models.
Cost of revenue related to the Company’s Managed Services include royalties paid to content owners on revenue generated from the Company’s licensing of their content, and fees charged by vendors that provide products and services in support of the Company’s live event services and obtaining of talent and property clearances.
67
Stock-Based Compensation
Stock-based compensation expense is estimated at the grant date based on the fair value of the award.
The fair values of restricted stock and restricted stock unit awards granted by the Company are based on the closing market price of the Company’s common stock on the date of grant.
The Company estimates the fair values of stock options having time-based vesting conditions, as well as purchase rights under the Company’s Employee Stock Purchase Plan (“ESPP”), using the Black-Scholes-Merton option pricing model. The Company’s performance-based stock options vest if a specified target price for the Company’s common stock is achieved. The Company estimates the fair values of performance-based stock options utilizing a Monte Carlo simulation model, to estimate the date that the specified stock price targets will be achieved (the attainment date), and the Black-Scholes-Merton option pricing model. A fair value is determined for each tranche of such performance-based stock options that is tied to a particular stock price target.
Determining the appropriate fair values of stock options and ESPP purchase rights at the grant date requires significant judgment, including estimating the volatility of the Company’s common stock, the expected term of awards, and the derived service periods for each tranche of performance stock options. In determining fair values, the Company estimated volatility based on the historical volatility of its own common stock along with the volatility of the peer group. In calculating estimated volatility, as the number of years of trading history for the Company’s common stock has increased, the volatility of the Company’s common stock has been given a weighting ranging from
The expected term for stock options other than performance-based stock options represents the period of time that stock options are expected to be outstanding and is determined using the simplified method. Under the simplified method, the expected term is calculated as the midpoint between the weighted average vesting date and the contractual term of the options. The expected term for performance-based stock options considers the remaining term of the option after the attainment date and the ratio of the stock price at the attainment date to the option exercise price.
The risk-free rate is based on the implied yield of U.S. Treasury notes as of the grant date with a remaining term approximately equal to the expected term of the award.
The assumptions used in the Company’s Black-Scholes-Merton option-pricing and Monte Carlo simulation models represent management’s best estimates. These estimates involve inherent uncertainties and the application of management’s judgment.
The fair value of stock-based awards (other than performance-based stock options) is amortized using the straight-line attribution method over the requisite service period of the award, which is generally the vesting period. For performance-based stock options, expense is recognized over a graded-vesting attribution basis over the period from the grant date to the estimated attainment date, which is the derived service period of each tranche of the award.
In recording stock-based compensation expense, the Company accounts for actual forfeitures as they occur and does not estimate forfeitures.
If performance options are modified, the fair values and the new derived service periods of the modified awards as of the date of modification and the fair values of the original awards immediately before the modification are determined. The amount of incremental compensation expense resulting from the modification of each award is equal to the excess of the fair value of the modified award on the date of modification over the fair value of the original award immediately before the modification. The incremental compensation expense is recognized over the new derived service period of the modified award.
Advertising and Marketing Costs
Advertising and marketing costs are expensed as incurred and are primarily included in sales and marketing expenses in the Company’s consolidated statements of operations and comprehensive loss. Advertising and marketing costs include personnel-related costs for sales and marketing resources, online and print advertising, public relations, tradeshows, and
68
sponsorships. For the years ended December 31, 2022 and 2021, the Company recorded expense of $
Research and Development Costs and Software Development Costs
Research and development costs are expensed as incurred. Computer software development costs and website development costs are expensed as incurred, except for internal use software that qualify for capitalization as described below.
The costs of internal use software that is developed to meet the Company’s needs and will not be marketed externally are subject to capitalization. The Company expenses costs incurred in the preliminary project and post-implementation stages of software development and capitalizes costs incurred in the application development stage and costs associated with significant enhancements to existing internal use software applications. These capitalized costs are included in property, equipment and improvements, net on the consolidated balance sheets and are amortized using the straight-line method over an estimated useful life of
Income Taxes
The Company accounts for income taxes using the asset and liability method. Under this method, deferred tax assets and liabilities are established for temporary differences between the financial statement carrying amounts and the tax bases of the Company’s assets and liabilities using statutory tax rates expected to apply to taxable income in the years in which those temporary differences are expected to reverse.
The Company assesses the likelihood that the deferred tax assets will be recovered from future taxable income and, if recovery is not more likely than not, the Company establishes a valuation allowance to reduce the deferred tax assets to the amounts expected to be realized. Realization of the deferred tax assets is dependent on the Company generating sufficient taxable income in future years to obtain a benefit from the reversal of temporary differences and from net operating losses.
The Company utilizes a two-step approach to recognizing and measuring uncertain tax positions. The first step is to determine whether the weight of available evidence indicates that it is more likely than not that the position will be sustained on audit, including resolution of related appeals or litigation processes. If the first test is met, then the second step is to measure the tax benefit as the largest amount which is more than 50% likely of being realized upon ultimate settlement.
Comprehensive Loss
Comprehensive loss consists of net loss and other gains and losses affecting equity that are excluded from net loss. These consist of foreign currency translation adjustments.
Segment Information
The Company reports segment information based on the internal reporting used by the chief operating decision maker for making decisions and assessing performance as the source of the Company’s reportable segments. As of October 1, 2021, the Company determined that there was a change in the internal reporting for such information reviewed by the chief operating decision maker. As a result, the Company determined that it has
The chief operating decision maker reviews financial information on a consolidated basis, accompanied by more detailed revenue information for Commercial Enterprise and Government & Regulated Industries (see Note 8), but does not evaluate other metrics such as cost of revenue, operating expenses, total assets, net income (loss), capital expenditures, goodwill or other intangible assets financial information on a more disaggregated basis. The Company’s revenues are generated primarily in the United States and it therefore does not report additional information on geographic segments.
Significant Customers
Concentration of Risk
Financial instruments that potentially subject the Company to concentrations of credit risk consist primarily of cash and cash equivalents and accounts receivable. The Company places its cash and cash equivalents with what management believes are quality financial institutions in the United States and management reviews its capital investment policies on an annual basis. At times, the value of the United States deposits exceeds federally insured limits. The Company has not experienced any losses in such accounts.
69
Recently Adopted Accounting Pronouncements
In February 2016, the FASB issued ASU No. 2016-02, Leases (Topic 842). The amendments under this pronouncement change the way all leases with duration of one year or more are treated. Under this guidance, lessees are required to capitalize virtually all leases on the balance sheet as a right-of-use asset and an associated financing lease liability or operating lease liability. On January 1, 2022, the Company adopted the new leasing standard using the modified retrospective transition method applied at the adoption date of the standard. See Note 9 for further details.
In December 2019, the FASB issued ASU No. 2019-12 to simplify the accounting in ASC 740, Income Taxes. This standard removes certain exceptions related to the approach for intra-period tax allocation, the methodology for calculating income taxes in an interim period, and the recognition of deferred tax liabilities for outside basis differences. This guidance also clarifies and simplifies other areas of ASC 740. The Company adopted this guidance on January 1, 2022 using the prospective transition method. The adoption of this guidance did not have a material impact on the Company’s consolidated financial statements.
In August 2020, the FASB issued ASU No. 2020—06, Debt—Debt with Conversion and Other Options (Subtopic 470-20) and Derivatives and Hedging—Contracts in Entity’s Own Equity (Subtopic 815-40): Accounting for Convertible Instruments and Contracts in an Entity’s Own Equity, which simplifies the accounting for convertible instruments by reducing the number of accounting models available for convertible instruments. This guidance also eliminates the treasury stock method to calculate diluted earnings per share for convertible instruments and requires the use of the if-converted method. The Company early adopted the standard as of January 1, 2021 and applied this guidance to the convertible senior notes issued in November 2021. Refer to Note 4 for additional information.
Recently Issued Accounting Pronouncements
In September 2016, the FASB issued ASU No. 2016-13, Financial Instruments – Credit Losses (Topic 326). which requires measurement and recognition of expected credit losses for financial assets held. This standard will be effective for the Company beginning in the first quarter of fiscal year 2023, and early adoption is permitted. The Company will adopt on January 1, 2023 and the adoption of this guidance is not expected to have a material impact on the Company's consolidated financial statements.
In October 2021, the FASB issued ASU No. 2021-08, Business Combinations (Topic 805): Accounting for Contract Assets and Contract Liabilities from Contracts with Customers, which requires entities to recognize and measure contract assets and contract liabilities acquired in a business combination in accordance with ASC Topic 606, Revenue from Contracts with Customers, in order to align the recognition of a contract liability with the definition of a performance obligation. This standard will be effective for the Company beginning in the first quarter of fiscal year 2023, and early adoption is permitted. The Company will adopt on January 1, 2023 and the adoption of this guidance is not expected to have a material impact on the Company's consolidated financial statements.
NOTE 3. BUSINESS COMBINATIONS
VSL Acquisition
On
The total purchase consideration was $
The following table summarizes the fair value of the VSL Acquisition Consideration (in thousands):
VSL Acquisition Consideration |
|
Amount |
|
|
Cash consideration at closing |
|
$ |
|
|
Deferred consideration |
|
|
|
|
Total |
|
$ |
|
|
70
The allocation of the VSL Acquisition Consideration to tangible and intangible assets acquired and liabilities assumed is based on estimated fair values and is as follows (in thousands):
Allocation of VSL Acquisition Consideration** |
|
Amount |
|
|
Accounts receivable, net |
|
$ |
|
|
Property, equipment and improvements, net |
|
|
|
|
Intangible assets |
|
|
|
|
Total assets acquired |
|
|
|
|
Accrued expenses and other current liabilities |
|
|
|
|
Total liabilities assumed |
|
|
|
|
Identifiable net assets acquired |
|
|
|
|
Goodwill |
|
|
|
|
Total purchase consideration |
|
$ |
|
|
**The excess of the total consideration over the tangible assets, identifiable intangible assets, and assumed liabilities is recorded as goodwill. Goodwill is primarily attributable to the assembled workforce. All goodwill generated from the acquisition is tax deductible.
Identifiable Intangible Assets
The identifiable intangible assets acquired consisted of developed technology valued at $
The fair value of the intangible assets has been estimated using a cost approach. Under the cost approach, the replacement cost is used to estimate the value of the asset. The key assumptions include the Company’s estimates of the direct and indirect costs required to replace the asset.
VocaliD Acquisition
On
The total purchase consideration was $
The following table summarizes the fair value of the VocaliD Acquisition Consideration (in thousands):
VocaliD Acquisition Consideration |
|
Amount |
|
|
Cash consideration at closing |
|
$ |
|
|
Deferred consideration |
|
|
|
|
Net working capital adjustment |
|
|
( |
) |
Total |
|
$ |
|
|
71
The allocation of the VocaliD Acquisition Consideration to tangible and intangible assets acquired and liabilities assumed is based on estimated fair values and is as follows (in thousands):
Allocation of VocaliD Acquisition Consideration** |
|
Amount |
|
|
Cash |
|
$ |
|
|
Intangible assets |
|
|
|
|
Total assets acquired |
|
|
|
|
Accounts payable |
|
|
|
|
Accrued expenses and other current liabilities |
|
|
|
|
Deferred tax liability |
|
|
|
|
Total liabilities assumed |
|
|
|
|
Identifiable net assets acquired |
|
|
|
|
Goodwill |
|
|
|
|
Total purchase consideration |
|
$ |
|
|
**The excess of the total consideration over the tangible assets, identifiable intangible assets, and assumed liabilities is recorded as goodwill. Goodwill is primarily attributable to the assembled workforce. The transaction is treated as a non-taxable stock acquisition for income tax purposes and
Identifiable Intangible Assets
The identifiable intangible assets acquired consisted of developed technology valued at $
The fair value of the intangible assets has been estimated using a cost approach. Under the cost approach, the replacement cost is used to estimate the value of the asset. The key assumptions include the Company’s estimates of the direct and indirect costs required to replace the asset.
March 2022 Acquisition
On
The total purchase consideration was $
72
The following table summarizes the fair value of the March Acquisition Consideration (in thousands):
March Acquisition Consideration |
|
Amount |
|
|
Cash consideration at closing |
|
$ |
|
|
Equity consideration at closing |
|
|
|
|
Deferred consideration |
|
|
|
|
Acquired cash |
|
|
|
|
Settlement of pre-existing receivable |
|
|
( |
) |
Net working capital adjustment |
|
|
|
|
Total |
|
$ |
|
|
The allocation of the March Acquisition Consideration to tangible and intangible assets acquired and liabilities assumed is based on estimated fair values and is as follows (in thousands):
Allocation of March Acquisition Consideration** |
|
Amount |
|
|
Cash |
|
$ |
|
|
Accounts receivable |
|
|
|
|
Prepaid and other current assets |
|
|
|
|
Property and equipment |
|
|
|
|
Intangible assets |
|
|
|
|
Other assets |
|
|
|
|
Total assets acquired |
|
|
|
|
Accounts payable |
|
|
|
|
Accrued expenses and other current liabilities |
|
|
|
|
Operating lease liabilities, non-current |
|
|
|
|
Total liabilities assumed |
|
|
|
|
Identifiable net assets acquired |
|
|
|
|
Goodwill |
|
|
|
|
Total purchase consideration |
|
$ |
|
|
**The excess of the total consideration over the tangible assets, identifiable intangible assets, and assumed liabilities is recorded as goodwill. Goodwill is primarily attributable to opportunities to cross-sell into our Commercial Enterprise customer base. For income tax purposes, the Company elected to treat the transaction as an asset acquisition. Tax deductible goodwill generated from the acquisition is $
Identifiable Intangible Assets
The identifiable intangible assets acquired consisted of the influencer network, trade name and brand relationships with estimated useful lives of
The fair value of the intangible assets has been estimated using an income approach. Under the income approach, the after-tax cash flows associated with the asset are discounted to present value. The key assumptions include the Company’s estimates of the projected cash flows and discount rates.
The valuation of the intangible assets acquired along with their estimated useful lives, is as follows (in thousands):
|
|
Estimated |
|
|
Estimated Useful Lives (in years) |
|
Influencer network |
|
$ |
|
|
||
Trade name |
|
|
|
|
||
Brand relationships |
|
|
|
|
||
Total intangible assets |
|
$ |
|
|
|
|
73
PandoLogic Acquisition
On
The total purchase consideration for PandoLogic was $
The following table summarizes the fair value of the Merger Consideration (in thousands):
Merger Consideration |
|
Amount |
|
|
Cash consideration at closing |
|
$ |
|
|
Equity consideration at closing |
|
|
|
|
Contingent earnout |
|
|
|
|
Net working capital adjustment |
|
|
|
|
Total |
|
$ |
|
|
The allocation of the Merger Consideration to tangible and intangible assets acquired and liabilities assumed is based on estimated fair values and is as follows (in thousands):
Allocation of Merger Consideration** |
|
Amount |
|
|
Cash |
|
$ |
|
|
Accounts receivable |
|
|
|
|
Prepaid and other current assets |
|
|
|
|
Property and equipment |
|
|
|
|
Intangible assets |
|
|
|
|
Other assets |
|
|
|
|
Total assets acquired |
|
|
|
|
Accounts payable |
|
|
|
|
Accrued expenses and other current liabilities |
|
|
|
|
Deferred tax liability |
|
|
|
|
Total liabilities assumed |
|
|
|
|
Identifiable net assets acquired |
|
|
|
|
Goodwill |
|
|
|
|
Total purchase consideration |
|
$ |
|
|
**The excess of the total consideration over the tangible assets, identifiable intangible assets, and assumed liabilities is recorded as goodwill. Goodwill is primarily attributable to operational efficiencies from operating PandoLogic products on aiWARE as well as opportunities to cross-sell into our Commercial Enterprise customer base.
74
Identifiable Intangible Assets
The identifiable intangible assets acquired consisted of developed technology, customer relationships and tradename with estimated useful lives of
The fair value of the intangible assets has been estimated using a combination of the income and cost approaches. Under the income approach, the after-tax cash flows associated with the asset are discounted to present value. The key assumptions include the Company’s estimates of the projected cash flows and discount rates. Under the cost approach, the replacement cost is used to estimate the value of the asset. The key assumptions include the Company’s estimates of the direct and indirect costs required to replace the asset.
|
|
Estimated |
|
|
Estimated Useful Lives (in years) |
|
Customer relationships |
|
$ |
|
|
||
Developed technology |
|
|
|
|
||
Trade name |
|
|
|
|
||
Total intangible assets |
|
$ |
|
|
|
|
Taxes
In connection with the acquisition, a net deferred tax liability of $
Unaudited Pro Forma Results
The unaudited pro forma financial information in the table below summarizes the combined results of operations for the Company and PandoLogic as if the companies were combined for the year ended December 31, 2021. The unaudited pro forma financial information for all periods presented included the business combination accounting effects resulting from this acquisition, including adjustments to reflect recognition of intangible asset amortization and accretion of contingent consideration. The unaudited pro forma financial information as presented below is for informational purposes only and is not necessarily indicative of the results of operations that would have been achieved if the acquisition had taken place at the beginning of January 1, 2021.
The unaudited pro forma financial information was as follows (in thousands):
|
|
Year Ended |
|
|
|
|
2021 |
|
|
Net revenue |
|
$ |
|
|
Loss before provision for income taxes |
|
|
( |
) |
Net loss |
|
|
( |
) |
NOTE 4. DEBT
Convertible Senior Notes
In November 2021, the Company issued, at par value, $
75
amount of Convertible Notes. The Convertible Notes were issued pursuant to and are subject to the terms and conditions of an indenture, which is referred to as the Indenture, between the Company and U.S. Bank National Association, as trustee. The Convertible Notes were offered and sold in a private offering to qualified institutional buyers pursuant to Rule 144A under the Securities Act of 1933, as amended. In December 2022, the Company repurchased $
The Convertible Notes are senior, unsecured obligations of the Company and bear interest at a rate of
Holders of the Convertible Notes may convert all or any portion of their Convertible Notes at their option at any time prior to the close of business on the business day immediately preceding May 15, 2026, only under the following conditions: (1) during any calendar quarter commencing after the calendar quarter ending on March 31, 2022 (and only during such calendar quarter), if the last reported sale price of the Company’s common stock for at least
The conversion rate for the Convertible Notes will initially be
The Company may not redeem the Convertible Notes prior to
If the Company undergoes a fundamental change prior to the maturity date, subject to certain conditions, holders may require the Company to repurchase for cash all or any portion of their Convertible Notes. The fundamental change repurchase price will be equal to
The Convertible Notes are the Company’s senior unsecured obligations and rank senior in right of payment to all of the Company’s indebtedness that is expressly subordinated in right of payment to the Convertible Notes; equal in right of payment with all existing and future liabilities of the Company that are not so subordinated; effectively junior to any of secured indebtedness of the Company to the extent of the value of the assets securing such indebtedness; and structurally
76
junior to all indebtedness and other liabilities (including trade payables) and any preferred equity of the Company’s current or future subsidiaries.
The net proceeds from the issuance of the Convertible Notes were approximately $
For the years ended December 31, 2022 and 2021, interest expense related to the Convertible Notes and amortization of the issuance costs was $
Capped Calls
In connection with the pricing of the Convertible Notes, with the full exercise by the initial purchasers of their option to purchase additional Convertible Notes in November 2021, the Company used approximately $
The capped call transactions cover, subject to anti-dilution adjustments substantially similar to those applicable to the Convertible Notes, the number of shares of the Company’s common stock underlying the Convertible Notes. The capped call transactions are expected generally to reduce the potential dilution to the Company’s common stock upon conversion of the Convertible Notes and/or offset some or all of any cash payments the Company is required to make in excess of the principal amount of converted Convertible Notes, as the case may be, in the event that the market price per share of the Company’s common stock, as measured under the terms of the capped call transactions, is greater than the strike price of the capped call transactions, which initially corresponds to the conversion price of the Convertible Notes and is subject to anti-dilution adjustments substantially similar to those applicable to the conversion rate of the Convertible Notes. If, however, the market price per share of the Company’s common stock, as measured under the terms of the capped call transactions, exceeds the cap price of the capped call transactions, there would nevertheless be dilution and/or there would not be an offset of such potential cash payments, in each case, to the extent that such market price exceeds the cap price of the capped call transactions. The initial cap price of the capped calls is $
The capped call transactions are separate transactions and are not part of the terms of the Convertible Notes. The capped calls meet the criteria for classification as equity and, as such, are not remeasured each reporting period and are included as a reduction to additional paid-in-capital within stockholders’ equity.
In connection with the Repurchase Transaction, the Company entered into transactions to unwind a portion of the capped calls. As a result, the Company received $
77
NOTE 5. NET LOSS PER SHARE
The following table presents the computation of basic and diluted net loss per share:
|
|
Year Ended |
|
|||||
|
|
2022 |
|
|
2021 |
|
||
Numerator |
|
|
|
|
|
|
||
Net loss |
|
$ |
( | ) |
|
$ |
( | ) |
Denominator |
|
|
|
|
|
|
||
Weighted-average common shares outstanding |
|
|
|
|
|
|
||
Less: Weighted-average shares subject to repurchase |
|
|
( |
) |
|
|
( |
) |
Denominator for basic and diluted net loss per share attributable to common stockholders |
|
|
|
|
|
|
||
Basic and diluted net loss per share |
|
$ |
( |
) |
|
$ |
( |
) |
The Company reported net losses for both periods presented and, as such, all potentially dilutive shares of common stock would have been antidilutive for such periods.
|
|
Year Ended |
|
|||||
|
|
2022 |
|
|
2021 |
|
||
Common stock options and restricted stock units |
|
|
|
|
|
|
||
Warrants to purchase common stock |
|
|
|
|
|
|
||
Common stock issuable in connection with convertible senior notes |
|
|
|
|
|
|
||
|
|
|
|
|
|
|
||
NOTE 6. FINANCIAL INSTRUMENTS
Cash, Cash Equivalents
The Company’s money market funds are categorized as Level 1 within the fair value hierarchy. As of December 31, 2022, the Company’s cash and cash equivalents were as follows:
|
|
|
|
|
Gross |
|
|
|
|
|
Cash and |
|
||||
|
|
|
|
|
Unrealized |
|
|
Fair |
|
|
Cash |
|
||||
|
|
Cost |
|
|
Losses |
|
|
Value |
|
|
Equivalents |
|
||||
Cash |
|
$ |
|
|
$ |
— |
|
|
$ |
|
|
$ |
|
|||
Level 1: |
|
|
|
|
|
|
|
|
|
|
|
|
||||
Money market funds |
|
|
|
|
|
— |
|
|
|
|
|
|
|
|||
Total |
|
$ |
|
|
$ |
— |
|
|
$ |
|
|
$ |
|
|||
As of December 31, 2021, the Company’s cash and cash equivalents balances were as follows:
|
|
|
|
|
Gross |
|
|
|
|
|
Cash and |
|
||||
|
|
|
|
|
Unrealized |
|
|
Fair |
|
|
Cash |
|
||||
|
|
Cost |
|
|
Losses |
|
|
Value |
|
|
Equivalents |
|
||||
Cash |
|
$ |
|
|
$ |
— |
|
|
$ |
|
|
$ |
|
|||
Level 1: |
|
|
|
|
|
|
|
|
|
|
|
|
||||
Money market funds |
|
|
|
|
|
— |
|
|
|
|
|
|
|
|||
Total |
|
$ |
|
|
$ |
— |
|
|
$ |
|
|
$ |
|
|||
Contingent Consideration
All of the Company’s contingent consideration liabilities are categorized as Level 3 within the fair value hierarchy. Contingent consideration for the PandoLogic acquisition was valued at the time of acquisition using Monte Carlo simulation models. These models incorporate contractual terms and assumptions regarding financial forecasts for PandoLogic, discount rates, and volatility of forecasted revenue. The value of the Company’s contingent consideration would increase if a lower
78
discount rate was used and would decrease if a higher discount rate was used. Similarly, a higher revenue volatility assumption would increase the value of the contingent consideration, and a lower revenue volatility assumption would decrease the value of the contingent consideration. Contingent consideration for the March 2022 acquisition was valued using a simple probability of achievement model, with the probability of achievement based on management’s forecasted outcomes for 2022 and 2023 fiscal year results for the acquired entity. The development and determination of the unobservable inputs for Level 3 fair value measurements and fair value calculations are the responsibility of the Company’s management with the assistance of a third-party valuation specialist.
In September 2022, the Company and PandoLogic entered into an amendment to the PandoLogic Merger Agreement. This amendment provides that the 2022 PandoLogic Earnout will be no less than $
As of December 31, 2022, the Company’s contingent consideration liabilities current and non-current balances were as follows:
|
|
|
|
|
Changes in |
|
|
Amount Paid |
|
|
Reclass from |
|
|
Fair |
|
|||||
|
|
Cost |
|
|
Fair Value |
|
|
To Date |
|
|
Current |
|
|
Value |
|
|||||
Level 3: |
|
|
|
|
|
|
|
|
|
|
|
|
|
|
|
|||||
Contingent consideration, current |
|
$ |
|
|
$ |
( |
) |
|
$ |
( | ) |
|
$ |
|
|
$ |
|
|||
Contingent consideration, non-current |
|
|
|
|
|
— |
|
|
|
— |
|
|
|
( |
) |
|
|
— |
|
|
Total |
|
$ |
|
|
$ |
( |
) |
|
$ |
( |
) |
|
$ |
— |
|
|
$ |
|
||
As of December 31, 2021, the Company’s contingent consideration liabilities current and non-current balances were as follows:
|
|
|
|
|
Changes in |
|
|
Fair |
|
|
Contingent |
|
||||
|
|
Cost |
|
|
Fair Value |
|
|
Value |
|
|
Consideration |
|
||||
Level 3: |
|
|
|
|
|
|
|
|
|
|
|
|
||||
Contingent consideration, current |
|
$ |
|
|
$ |
|
|
$ |
|
|
$ |
|
||||
Contingent consideration, non-current |
|
|
|
|
|
|
|
|
|
|
|
|
||||
Total |
|
$ |
|
|
$ |
|
|
$ |
|
|
$ |
|
||||
Stock Warrants
All of the Company’s outstanding stock warrants are categorized as Level 3 within the fair value hierarchy. Stock warrants have been recorded at their fair value using either a probability weighted expected return model, the Monte Carlo simulation model or the Black-Scholes option-pricing model. These models incorporate contractual terms, maturity, risk-free interest rates and volatility. The value of the Company’s stock warrants would increase if a higher risk-free interest rate was used and would decrease if a lower risk-free interest rate was used. Similarly, a higher volatility assumption would increase the value of the stock warrants, and a lower volatility assumption would decrease the value of the stock warrants. The development and determination of the unobservable inputs for Level 3 fair value measurements and fair value calculations are the responsibility of the Company’s management with the assistance of a third-party valuation specialist.
In April 2020, in connection with a consulting agreement between the Company and a consulting firm, the Company issued to such firm a warrant to purchase up to
The following table summarizes quantitative information with respect to the significant unobservable inputs that were used to value the 2020 Performance Warrant:
79
|
|
Performance Warrant |
|
|
Volatility |
|
|
% |
|
Risk-free rate |
|
|
% |
|
Term |
|
|
|
|
In April 2018, in connection with the advisory agreement between the Company and a financial advisory firm, the Company issued such firm a
Investments
During the year ended December 31, 2022, the Company invested $
NOTE 7. GOODWILL AND INTANGIBLE ASSETS, NET
Goodwill
The carrying amount of goodwill was $
|
|
Goodwill |
|
|
Balance at December 31, 2021 |
|
$ |
|
|
March 2022 acquisition |
|
|
|
|
VocaliD acquisition |
|
|
|
|
VSL acquisition |
|
|
|
|
Foreign currency translation/other |
|
|
( |
) |
Balance at December 31, 2022 |
|
$ |
|
|
Intangible Assets
The following table sets forth the Company’s finite-lived intangible assets resulting from business acquisitions and other purchases, which continue to be amortized:
|
|
|
|
|
December 31, |
|
|
December 31, |
|
|||||||||||||||||||
|
|
Weighted |
|
|
Gross |
|
|
Accumulated |
|
|
Net |
|
|
Gross |
|
|
Accumulated |
|
|
Net |
|
|||||||
Software and technology |
|
|
|
|
$ |
|
|
$ |
( |
) |
|
$ |
— |
|
|
$ |
|
|
$ |
( |
) |
|
$ |
|
||||
Licensed technology |
|
|
|
|
|
|
|
|
( |
) |
|
|
— |
|
|
|
|
|
|
( |
) |
|
|
— |
|
|||
Developed technology |
|
|
|
|
|
|
|
|
( |
) |
|
|
|
|
|
|
|
|
( |
) |
|
|
|
|||||
Customer and supplier relationships |
|
|
|
|
|
|
|
|
( |
) |
|
|
|
|
|
|
|
|
( |
) |
|
|
|
|||||
Noncompete agreements |
|
|
|
|
|
|
|
|
( |
) |
|
|
— |
|
|
|
|
|
|
( |
) |
|
|
|
||||
Trademarks and trade names |
|
|
|
|
|
|
|
|
( |
) |
|
|
|
|
|
|
|
|
( |
) |
|
|
|
|||||
Total |
|
|
|
|
$ |
|
|
$ |
( |
) |
|
$ |
|
|
$ |
|
|
$ |
( |
) |
|
$ |
|
|||||
80
The following table presents future amortization of the Company’s finite-lived intangible assets as of December 31, 2022:
2023 |
|
$ |
|
|
2024 |
|
|
|
|
2025 |
|
|
|
|
2026 |
|
|
|
|
2027 |
|
|
|
|
Thereafter |
|
|
|
|
Total |
|
$ |
|
NOTE 8. CONSOLIDATED FINANCIAL STATEMENTS DETAILS
Consolidated Balance Sheets Details
Cash and cash equivalents
As of December 31, 2022 and December 31, 2021, the Company had cash and cash equivalents of $
Accounts Receivable, Net
Accounts receivable consisted of the following:
|
|
As of |
|
|||||
|
|
December 31, |
|
|
December 31, |
|
||
Accounts receivable — Managed Services(1) |
|
$ |
|
|
$ |
|
||
Accounts receivable — Software Products & Services(2) |
|
|
|
|
|
|
||
Accounts receivable — Other |
|
|
|
|
|
|
||
|
|
|
|
|
|
|
||
Less: allowance for doubtful accounts |
|
|
( |
) |
|
|
( |
) |
Accounts receivable, net |
|
$ |
|
|
$ |
|
||
Property, Equipment and Improvements, Net
Property, equipment and improvements, net consisted of the following:
|
|
As of |
|
|||||
|
|
December 31, |
|
|
December 31, |
|
||
Property and equipment |
|
$ |
|
|
$ |
|
||
Leasehold improvements |
|
|
|
|
|
|
||
|
|
|
|
|
|
|
||
Less: accumulated depreciation |
|
|
( |
) |
|
|
( |
) |
Property, equipment and improvements, net |
|
$ |
|
|
$ |
|
||
Depreciation expense was $
81
During 2021, primarily in connection with the sublease of its former corporate office space located in Costa Mesa, California, the Company wrote-off approximately $
Accounts Payable
Accounts payable consisted of the following:
|
|
As of |
|
|||||
|
|
December 31, |
|
|
December 31, |
|
||
Accounts payable — Managed Services(1) |
|
$ |
|
|
$ |
|
||
Accounts payable — Other |
|
|
|
|
|
|
||
Total |
|
$ |
|
|
$ |
|
||
Consolidated Statements of Operations and Comprehensive Loss Details
Revenue
Revenue for the periods presented were comprised of the following:
|
|
Year Ended |
|
|||||
|
|
2022 |
|
|
2021 |
|
||
Commercial Enterprise |
|
$ |
|
|
$ |
|
||
Government & Regulated Entities |
|
|
|
|
|
|
||
Total revenue |
|
$ |
|
|
$ |
|
||
In the third quarter of fiscal year 2021, the Company realigned its organization to improve focus and growth into two customer groups: (1) Commercial Enterprise, which today consists of customers in the commercial sector, including media and entertainment customers, advertising customers, content licensing customers and PandoLogic customers; and (2) Government & Regulated Industries, which today consists of customers in the government and regulated industries sectors, including state, local and federal government, legal, compliance and energy customers.
Software Products & Services consists of revenue generated from the Company’s aiWARE platform and PandoLogic’s talent acquisition solutions, any related support and maintenance services, and any related professional services associated with the deployment and or implementation of such solutions.
82
Managed Services consists of revenues generated from content licensing customers and advertising agency customers and related services.
The table below illustrates the presentation of our revenues based on the above definitions:
|
|
Year Ended |
|
|
|||||||||
|
|
|
|
|
Government & |
|
|
|
|
|
|||
|
|
Commercial |
|
|
Regulated |
|
|
|
|
|
|||
|
|
Enterprise |
|
|
Industries |
|
|
Total |
|
|
|||
Total Software Products & Services(1) |
|
$ |
|
|
$ |
|
|
$ |
|
|
|||
|
|
|
|
|
|
|
|
|
|
|
|||
Managed Services |
|
|
|
|
|
|
|
|
|
|
|||
Advertising |
|
|
|
|
|
— |
|
|
|
|
|
||
Licensing |
|
|
|
|
|
— |
|
|
|
|
|
||
Total Managed Services |
|
|
|
|
|
— |
|
|
|
|
|
||
|
|
|
|
|
|
|
|
|
|
|
|||
Total Revenue |
|
$ |
|
|
$ |
|
|
$ |
|
|
|||
|
|
Year Ended |
|
|||||||||
|
|
|
|
|
Government & |
|
|
|
|
|||
|
|
Commercial |
|
|
Regulated |
|
|
|
|
|||
|
|
Enterprise |
|
|
Industries |
|
|
Total |
|
|||
Total Software Products & Services(1) |
|
$ |
|
|
$ |
|
|
$ |
|
|||
|
|
|
|
|
|
|
|
|
|
|||
Managed Services |
|
|
|
|
|
|
|
|
|
|||
Advertising |
|
|
|
|
|
— |
|
|
|
|
||
Licensing |
|
|
|
|
|
— |
|
|
|
|
||
Total Managed Services |
|
|
|
|
|
— |
|
|
|
|
||
|
|
|
|
|
|
|
|
|
|
|||
Total Revenue |
|
$ |
|
|
$ |
|
|
$ |
|
|||
Other Income (Expense), Net
Other income (expense), net for the periods presented was comprised of the following:
|
|
Year Ended |
|
|||||
|
|
2022 |
|
|
2021 |
|
||
Interest expense, net |
|
$ |
( |
) |
|
$ |
( |
) |
Gain on debt extinguishment |
|
$ |
|
|
|
— |
|
|
Other |
|
|
|
|
|
( |
) |
|
Other income (expense), net |
|
$ |
|
|
$ |
( |
) |
|
NOTE 9. LEASES, COMMITMENTS AND CONTINGENCIES
Leases
Adoption of the New Lease Accounting Standard
On January 1, 2022, the Company adopted ASU No. 2016-02, Leases (Topic 842), using the modified retrospective transition method applied at the adoption date of the standard. Results for reporting periods beginning after January 1, 2022 are presented under the new leasing standard, while prior period amounts are not adjusted and continue to be reported in accordance with the Company’s historic accounting. The Company has elected to utilize the package of practical expedients at the time of adoption, which allows the Company to (1) not reassess whether any expired or existing contracts are or
83
contain leases, (2) not reassess the lease classification of any expired or existing leases, and (3) not reassess initial direct costs for any existing leases. The Company also has elected to utilize the short-term lease recognition exemption and, for those leases that qualified, the Company did not recognize right-of-use (“ROU”) assets or lease liabilities.
As a result of adoption, the Company recorded ROU assets related to office facility leases which are recognized on the consolidated balance sheet within “other assets” and the associated lease liabilities are recognized on the consolidated balance sheet within “other accrued liabilities” and “other non-current liabilities.” The present value of the Company’s remaining lease payments, which comprise the lease liabilities, was estimated using the incremental borrowing rate as of the adoption date.
The cumulative effects of the changes made to the Company’s January 1, 2022 consolidated balance sheet were as follows:
|
|
December 31, 2021 |
|
|
Adjustments Due to Adoption of New Leasing Standard |
|
|
January 1, |
|
|||
Assets |
|
|
|
|
|
|
|
|
|
|||
Prepaid expenses and other current assets |
|
$ |
|
|
$ |
|
|
$ |
|
|||
Other assets |
|
|
|
|
|
|
|
|
|
|||
|
|
|
|
|
|
|
|
|
|
|||
Liabilities |
|
|
|
|
|
|
|
|
|
|||
Other accrued liabilities |
|
$ |
|
|
$ |
|
|
$ |
|
|||
Other non-current liabilities |
|
|
|
|
|
|
|
|
|
|||
|
|
|
|
|
|
|
|
|
|
|||
Stockholders' Equity |
|
|
|
|
|
|
|
|
|
|||
Accumulated deficit |
|
$ |
( |
) |
|
$ |
( |
) |
|
$ |
( |
) |
New Lease Accounting Policies
The Company determines if an arrangement is a lease at inception and determine the classification of the lease, as either operating or finance, at commencement. The Company has various operating leases for its offices. These existing leases have remaining lease terms ranging from
ROU assets represent the Company’s right to use an underlying asset for the lease term and lease liabilities represent the obligation to make lease payments arising from the lease. Operating lease ROU assets and liabilities are recognized at commencement date based on the present value of lease payments over the lease term. As the rate implicit in the Company’s leases is not readily determinable, the Company uses its incremental borrowing rate based on the information available at the lease commencement date in determining the present value of lease payments. The Company estimates the incremental borrowing rate to reflect the profile of secured borrowing over the expected term of the leases based on the information available at the later of the initial date of adoption or the lease commencement date.
The operating lease ROU asset also includes any lease payments made and excludes lease incentives received at or before lease commencement. Lease expense for lease payments is recognized on a straight-line basis over the lease term. Sublease rental income is recognized as a reduction to the related lease expense on a straight-line basis over the sublease term.
Lease Costs
As of December 31, 2022, on its consolidated balance sheet the Company has right-of-use assets of $
The Company made cash payments for its operating leases of $
84
Company’s operating leases have a weighted average remaining lease term of
In February 2021, the Company entered into an office sublease (the “Sublease”) with a third party (the “Subtenant”), pursuant to which the Company has subleased its former office space located in Costa Mesa, California, consisting of approximately
The total rent expense for all operating leases was $
Lease Commitments
Years ended December 31, |
|
|
|
|
2023 |
|
$ |
|
|
2024 |
|
|
|
|
2025 |
|
|
|
|
Total future minimum lease payments, including short-term leases |
|
|
|
|
Less: future minimum lease payments for short-term leases |
|
|
( |
) |
Less: imputed interest |
|
|
( |
) |
Present value of future minimum lease payments, excluding short-term leases |
|
$ |
|
|
Less: current portion of operating lease liabilities |
|
|
( |
) |
Non-current portion of operating lease liabilities |
|
|
|
|
|
|
|
|
|
Years ended December 31, |
|
Sublease Income |
|
|
2023 |
|
$ |
|
|
2024 |
|
|
|
|
Total sublease income |
|
$ |
|
|
As previously disclosed in the Company’s Annual Report on Form 10-K for the year ended December 31, 2021 under the previous lease accounting standard, future minimum lease payments at December 31, 2021, on an undiscounted basis, were as follows:
2022 |
|
$ |
|
|
2023 |
|
|
|
|
2024 |
|
|
|
|
Total minimum payments |
|
$ |
|
As of December 31, 2021, minimum sublease rental income to be received in the future under noncancelable subleases was approximately $
Purchase Consideration
In connection with its March 2022 acquisition, the Company committed to make purchase consideration payments of $
85
of the second anniversary of the closing date of the acquisition. In connection with its VocaliD acquisition, the Company committed to make purchase consideration payments of $
Other Contingencies
From time to time, the Company may be involved in litigation relating to claims arising out of its operations in the normal course of business. The Company currently is not a party to any legal proceedings, the adverse outcome of which, in management’s opinion, individually or in the aggregate, would have a material adverse effect on the Company’s results of operations, financial position or cash flows.
NOTE 10. STOCKHOLDERS’ EQUITY
Common Stock Issuances
During the years ended December 31, 2022 and 2021, the Company issued an aggregate of
During the year ended December 31, 2022, the Company issued a total of
During the year ended December 31, 2021, the Company issued a total of
During the year ended December 31, 2021, the Company issued an aggregate of
Common Stock Warrants
The table below summarizes the warrants outstanding at December 31, 2022:
|
|
|
|
|
|
|
Number of |
|
||
|
|
|
|
Exercise |
|
|
Shares of |
|
||
Issuance Date |
|
Life in Years |
|
Price |
|
|
Common Stock |
|
||
|
|
$ |
|
|
|
|
||||
|
|
$ |
|
|
|
|
||||
|
|
$ |
|
|
|
|
||||
|
|
|
|
|
|
|
|
|
||
The table below summarizes the warrants outstanding at December 31, 2021:
|
|
|
|
|
|
|
Number of |
|
||
|
|
|
|
Exercise |
|
|
Shares of |
|
||
Issuance Date |
|
Life in Years |
|
Price |
|
|
Common Stock |
|
||
|
|
$ |
|
|
|
|
||||
|
|
$ |
|
|
|
|
||||
|
|
$ |
|
|
|
|
||||
|
|
|
|
|
|
|
|
|
||
86
NOTE 11. STOCK PLANS
2014 Stock Incentive Plan
In 2014, the Company’s Board of Directors and stockholders approved and adopted the 2014 Stock Option/Stock Issuance Plan (the “2014 Plan”), which was amended in March 2015, October 2016 and April 2017. Under the 2014 Plan, incentive stock options, nonstatutory stock options, restricted stock and restricted stock units may be granted to eligible employees, directors and consultants. The Company’s Board of Directors resolved not to make any further awards under the 2014 Plan following the completion of the Company’s IPO. The 2014 Plan will continue to govern all outstanding awards granted thereunder.
2017 Stock Incentive Plan
In April 2017, the Company’s Board of Directors and stockholders approved and adopted the 2017 Stock Incentive Plan (the “2017 Plan”), which became effective on May 11, 2017. Under the 2017 Plan, incentive stock options, nonstatutory stock options, stock appreciation rights, stock awards and restricted stock units may be granted to employees, non-employee directors, consultants and advisors. Awards granted under the 2017 Plan may be subject to time-based and/or performance-based vesting conditions. The Company had initially reserved
2018 Performance-Based Stock Incentive Plan
In June 2018, the Company’s stockholders approved the Company’s 2018 Performance-Based Stock Incentive Plan (the “2018 Plan”), and approved grants under the 2018 Plan of nonstatutory stock options, having performance-based vesting conditions tied to the future achievement of stock price milestones by the Company (each, a “Performance Option”), to the Company’s Chief Executive Officer for
The 2018 Plan allows the Company to grant Performance Options to its executive officers and other employees as an incentive for them to remain in service with the Company and to further align their interests with the interests of the Company’s stockholders. A total of
As of December 31, 2022,
Inducement Grant Plan
In October 2020, the Company’s Board of Directors adopted the Company’s Inducement Grant Plan. Under the Inducement Grant Plan, nonstatutory stock options, stock appreciation rights, stock awards, restricted stock units and dividend equivalent rights may be granted as an inducement material for eligible persons to enter into employment with the Company in accordance with NASDAQ Marketplace Rule 5635(c)(4) and the related guidance under NASDAQ IM 5635-1, and any amendments or supplements thereto. The Company has initially reserved
Terms of Awards Under Stock Plans
The 2014 Plan, 2017 Plan, 2018 Plan and Inducement Grant Plan are collectively referred to herein as the “Stock Plans.” The Stock Plans are administered by the Compensation Committee of the Board of Directors, which determines the recipients and the terms of the awards granted (with the exception of the CEO Award and President Award, which were approved by the Special Committee). All stock options granted under the Stock Plans have exercise prices equal to or greater than the fair market value of the Company’s common stock on the grant date, and expire ten years after the grant date, subject to earlier expiration in the event of termination of the optionee’s continuous service with the Company as further described in each Stock Plan. The vesting of all awards granted under the Stock Plans is generally subject to the awardee’s continuous service with the Company, with certain exceptions, as further described in each Stock Plan.
87
The Company has granted to employees, non-employee directors and consultants awards of stock options, restricted stock and restricted stock units that are subject to time-based vesting conditions. The time-based stock options that have been granted to employees and consultants generally vest over a period of
The Company has also granted Performance Options under the 2018 Plan, the 2017 Plan and the Inducement Grant Plan. All such Performance Options become exercisable in three equal tranches based on the achievement of specific stock price milestones for the Company’s common stock. These stock price milestones were amended in August 2020 with respect to substantially all of the Performance Options outstanding at such time, as discussed below. For each tranche to become exercisable, the closing price per share of the Company’s common stock must meet or exceed the applicable stock price target for a period of 30 consecutive trading days. In the first quarter of 2021, the Company achieved all of the stock price milestones and, accordingly, substantially all of the then-outstanding Performance Options have vested in full.
Stock-based Compensation
The Company recognizes stock-based compensation expense for awards granted under the Stock Plans ratably over the requisite service period. For awards subject to time-based vesting conditions, the service period is generally the vesting period. For Performance Options, a derived service period is estimated for each tranche under the Monte Carlo simulation model. The Company also recognizes stock-based compensation expense related to the Company’s ESPP ratably over each purchase interval.
The Company has also issued shares of common stock to consultants in exchange for services under separate agreements outside of the Stock Plans. These share-based payment transactions are measured based on the fair value of the common stock issued and are recognized in the period in which the services are rendered.
The fair values of time-based stock options granted under the Stock Plans and purchase rights under the ESPP are determined as of the grant date using the Black-Scholes-Merton option-pricing model.
|
|
Year ended |
|
|
Year Ended |
|
||
Expected term (in years) |
|
|
|
|
||||
Expected volatility |
|
|
|
|
||||
Risk-free interest rate |
|
|
|
|
||||
Expected dividend yield |
|
|
— |
|
|
|
— |
|
The assumptions used in calculating the fair values of purchase rights granted under the ESPP during the years ended December 31, 2022 and 2021 are set forth in the table below:
|
|
Year ended |
|
|
Year Ended |
|
||
Expected term (in years) |
|
|
|
|
||||
Expected volatility |
|
|
|
|
||||
Risk-free interest rate |
|
|
|
|
||||
Expected dividend yield |
|
|
— |
|
|
|
— |
|
88
The stock-based compensation expense by type of award and by operating expense grouping are presented below:
|
|
Year Ended |
|
|||||
|
|
2022 |
|
|
2021 |
|
||
Stock-based compensation expense by type of award: |
|
|
|
|
|
|
||
Restricted stock units |
|
$ |
|
|
$ |
|
||
Stock awards |
|
|
— |
|
|
|
|
|
Performance-based stock options |
|
|
— |
|
|
|
|
|
Stock options |
|
|
|
|
|
|
||
Employee stock purchase plan |
|
|
|
|
|
|
||
Common stock issued for services |
|
|
|
|
|
|
||
Total stock-based compensation expense |
|
$ |
|
|
$ |
|
||
|
|
|
|
|
|
|
||
Stock-based compensation expense by operating expense grouping: |
|
|
|
|
|
|
||
Cost of revenue |
|
$ |
|
|
$ |
|
||
Sales and marketing |
|
|
|
|
|
|
||
Research and development |
|
|
|
|
|
|
||
General and administrative |
|
|
|
|
|
|
||
Total stock-based compensation expense |
|
|
|
|
|
|
||
89
Stock Plan Activity
Restricted Stock Units
The Company’s restricted stock unit activity for the year ended December 31, 2022 was as follows:
|
|
|
|
|
Weighted |
|
||
|
|
|
|
|
Average Grant |
|
||
|
|
Shares |
|
|
Date Fair Value |
|
||
Unvested at December 31, 2021 |
|
|
|
|
$ |
|
||
Granted |
|
|
|
|
$ |
|
||
Forfeited |
|
|
( |
) |
|
$ |
|
|
Vested |
|
|
( |
) |
|
$ |
|
|
Unvested at December 31, 2022 |
|
|
|
|
$ |
|
||
As of December 31, 2022, total unrecognized compensation cost related to restricted stock units was $
Performance Options
Performance-Based Stock Options
The activity during the year ended December 31, 2022 related to stock options that are subject to performance-based vesting conditions tied to the achievement of stock price goals by the Company was as follows:
|
|
|
|
Weighted-Average |
|
|||||||||
|
|
|
|
|
|
|
|
Remaining |
|
Aggregate |
|
|||
|
|
|
|
|
Exercise |
|
|
Contractual |
|
Intrinsic |
|
|||
|
|
Options |
|
|
Price |
|
|
Term |
|
Value |
|
|||
Outstanding at December 31, 2021 |
|
|
|
|
$ |
|
|
|
|
|
|
|||
Exercised |
|
|
( |
) |
|
$ |
|
|
|
|
|
|
||
Expired |
|
|
( |
) |
|
$ |
|
|
|
|
|
|
||
Outstanding at December 31, 2022 |
|
|
|
|
$ |
|
|
|
$ |
|
||||
Exercisable at December 31, 2022 |
|
|
|
|
$ |
|
|
|
$ |
|
||||
The aggregate intrinsic value of the options exercised during the years ended December 31, 2022 and 2021 was $
Stock Options
The activity during the year ended December 31, 2022 related to all other stock options was as follows:
90
|
|
|
|
Weighted-Average |
|
|||||||||
|
|
|
|
|
|
|
|
Remaining |
|
Aggregate |
|
|||
|
|
|
|
|
Exercise |
|
|
Contractual |
|
Intrinsic |
|
|||
|
|
Options |
|
|
Price |
|
|
Term |
|
Value |
|
|||
Outstanding at December 31, 2021 |
|
|
|
|
$ |
|
|
|
|
|
|
|||
Granted |
|
|
|
|
$ |
|
|
|
|
|
|
|||
Exercised |
|
|
( |
) |
|
$ |
|
|
|
|
|
|
||
Forfeited |
|
|
( |
) |
|
$ |
|
|
|
|
|
|
||
Expired |
|
|
( |
) |
|
$ |
|
|
|
|
|
|
||
Outstanding at December 31, 2022 |
|
|
|
|
$ |
|
|
|
$ |
|
||||
Exercisable at December 31, 2022 |
|
|
|
|
$ |
|
|
|
$ |
|
||||
The weighted average grant date fair value of stock options granted during the years ended December 31, 2022 and 2021 was $
The aggregate intrinsic values in the tables above represent the difference between the fair market value of the Company’s common stock and the average option exercise price of in-the-money options, multiplied by the number of such stock options.
Employee Stock Purchase Plan
In April 2017, the Company’s Board of Directors and stockholders approved and adopted the ESPP, which became effective on May 11, 2017. The ESPP is administered by the Compensation Committee of the Board of Directors and is intended to qualify as an employee stock purchase plan under Section 423 of the Internal Revenue Code.
The purchase price for shares of the Company’s common stock under the ESPP will be established by the plan administrator prior to the start of the offering period, but will not be less than
The Company had initially reserved
The ESPP contains a reset provision, which provides that, if the Company’s stock price on any purchase date under an offering period is less than the stock price on the start date of that offering period, then all employees participating in that offering period will be automatically transferred to the new offering period starting on the next business day following such purchase date, so long as the stock price on that start date is lower than the stock price on the start date of the offering period in which they are enrolled.
91
Employee payroll deductions accrued under the ESPP as of December 31, 2022 and 2021 totaled $
NOTE 12. PROVISION FOR INCOME TAXES
The components of the Company’s loss before the provision for income taxes consisted of the following:
|
|
Year Ended |
|
|||||
|
|
2022 |
|
|
2021 |
|
||
United States of America |
|
$ |
( |
) |
|
$ |
( |
) |
Foreign |
|
|
( |
) |
|
|
|
|
Total |
|
$ |
( |
) |
|
$ |
( |
) |
The provision for income taxes consisted of the following for the years ended December 31, 2022 and 2021:
|
|
Year Ended |
|
|||||
|
|
2022 |
|
|
2021 |
|
||
Current |
|
|
|
|
|
|
||
Federal |
|
$ |
|
|
$ |
|
||
State |
|
|
|
|
|
|
||
Foreign |
|
|
|
|
|
|
||
Total current provision |
|
|
|
|
|
|
||
|
|
|
|
|
|
|
||
Deferred |
|
|
|
|
|
|
||
Federal |
|
|
|
|
|
( |
) |
|
State |
|
|
|
|
|
( |
) |
|
Foreign |
|
|
( |
) |
|
|
( |
) |
|
|
|
|
|
|
|
||
Change in valuation allowance |
|
|
( |
) |
|
|
|
|
Total deferred benefit |
|
|
( |
) |
|
|
( |
) |
Total provision for income taxes |
|
$ |
|
|
$ |
|
||
A reconciliation of the statutory U.S. federal income tax rate to the Company's effective tax rate for the years ended December 31, 2022 and 2021 is as follows:
|
|
Year Ended |
|
|||||
|
|
2022 |
|
|
2021 |
|
||
Tax, computed at the federal statutory rate |
|
|
% |
|
|
% |
||
State taxes, net of federal tax benefit |
|
|
|
|
|
|
||
Impact of foreign operations |
|
|
( |
) |
|
|
( |
) |
Research and development credits |
|
|
|
|
|
|
||
Stock-based compensation |
|
|
( |
) |
|
|
|
|
Earn-out revaluation |
|
|
|
|
|
( |
) |
|
Meals, entertainment and other |
|
|
( |
) |
|
|
( |
) |
Change in valuation allowance |
|
|
( |
) |
|
|
( |
) |
(Provision for) benefit from income taxes |
|
|
( | )% |
|
|
( | )% |
92
The significant components of the Company’s deferred income tax assets and liabilities as of December 31, 2022 and 2021 were as follows:
|
|
Year Ended |
|
|||||
|
|
2022 |
|
|
2021 |
|
||
Net operating loss carryforwards |
|
$ |
|
|
$ |
|
||
Stock-based compensation |
|
|
|
|
|
|
||
Accrued expenses |
|
|
|
|
|
|
||
Capitalized research and development |
|
|
|
|
|
— |
|
|
Lease liability |
|
|
|
|
|
— |
|
|
Research credits |
|
|
|
|
|
|
||
Other |
|
|
|
|
|
|
||
Total gross deferred tax assets |
|
|
|
|
|
|
||
Valuation allowance |
|
|
( |
) |
|
|
( |
) |
Total deferred tax assets |
|
|
|
|
|
|
||
|
|
|
|
|
|
|
||
Right of use assets |
|
|
( |
) |
|
|
— |
|
Unremitted foreign earnings |
|
|
( |
) |
|
|
— |
|
Other |
|
|
( |
) |
|
|
— |
|
Other - fixed assets and intangibles |
|
|
( |
) |
|
|
( |
) |
Acquired intangibles |
|
|
( |
) |
|
|
( |
) |
Total deferred tax liabilities |
|
|
( |
) |
|
|
( |
) |
Net deferred tax liabilities |
|
$ |
( | ) |
|
$ |
( | ) |
The Company has evaluated the available positive and negative evidence supporting the realization of its gross deferred tax assets, including its cumulative losses, and the amount and timing of future taxable income, and has determined it is more likely than not that certain historical U.S. federal and state deferred tax assets will not be realized. Accordingly, the Company recorded a valuation allowance as of December 31, 2022 and 2021 against these deferred tax assets.
The change in the valuation allowance for the years ended December 31, 2022 and 2021 is as follows:
|
|
Year Ended |
|
|||||
|
|
2022 |
|
|
2021 |
|
||
Valuation allowance, at beginning of year |
|
$ |
|
|
$ |
|
||
Increase in valuation allowance |
|
|
( |
) |
|
|
|
|
Valuation allowance, at end of year |
|
$ |
|
|
$ |
|
||
As of December 31, 2022, the Company has federal and state income tax net operating loss carryforwards of approximately $
In connection with the Company's acquisition of PandoLogic in September 2021, the Company recorded a net deferred tax liability primarily related to acquired non-goodwill intangible fair value in excess of tax basis. No valuation allowance is recorded against acquired PandoLogic Israel's deferred tax assets as it is more likely than not they will be utilized to offset future taxable income.
In August 2021, PandoLogic obtained the approval for the Israeli Preferred Technology Enterprise (“PTE”) status which provides beneficial tax treatment for Israeli companies engaged in R&D activities that own the intellectual property rights. Under PTE status, the Company's Israeli tax rate is reduced from the
93
during 2022. The effect of this tax incentive arrangement increased our income tax provision, as compared to the statutory rate, by $
Prior to the September 2021 PandoLogic acquisition, PandoLogic received certain favorable tax treatment from the Israeli tax authorities predicated on PandoLogic’s continued reinvestment of its earnings and profits back into Israel (“Pre-acquisition E&P”). Beyond fiscal year 2022 and in the event the Company declares a dividend and takes distributions on any of PandoLogic’s Pre-acquisition E&P, a portion of those distributions would be subject to a
In accordance with the U.S. global intangible low-taxed income (“GILTI”) provisions, we include in our U.S. income tax return foreign subsidiary earnings in excess of an allowable return on the foreign subsidiary’s tangible assets. We account for the GILTI tax in the period in which it is incurred, and therefore have not provided any deferred tax impacts of GILTI in our consolidated financial statements.
As of December 31, 2022 and 2021, the Company had approximately $
A reconciliation of the unrecognized tax benefits from January 1, 2021 to December 31, 2022 is as follows:
|
|
Year Ended |
|
|||||
|
|
2022 |
|
|
2021 |
|
||
Unrecognized tax benefits as of January 1 |
|
$ |
|
|
$ |
|
||
Gross increase for tax positions of prior years |
|
|
( | ) |
|
|
— |
|
Gross increase for tax positions of current year |
|
|
|
|
|
|
||
Unrecognized tax benefits balance at December 31 |
|
$ |
|
|
$ |
|
||
The Company is subject to taxation in the United States, Israel, the United Kingdom, and various U.S. states. In general, the U.S. federal statute of limitations is three years. However, the Internal Revenue Service may still adjust a tax loss or credit carryover in the year the tax loss or credit carryover is utilized. As such, our U.S. federal tax returns and state tax returns are open for examination since inception. The Israeli statute of limitations period is generally three years commencing at the end of the year in which the return was filed. The Company is not currently under examination from income tax authorities in the jurisdictions in which the Company does business.
On August 16, 2022, the U.S. government enacted the Inflation Reduction Act (“IRA”), which, among others, implements a
NOTE 13. RELATED PARTY TRANSACTIONS
There were
NOTE 14. SUBSEQUENT EVENTS
Effective December 31, 2022, Chad Steelberg resigned as Chief Executive Officer of the Company, and on January 1, 2023, the Board of Directors appointed Ryan Steelberg as President and Chief Executive Officer. Chad Steelberg will continue to provide services to the Company in his role as Chairman of the Board of Directors. In connection with these management transitions, the Company entered into new employment agreements with Ryan Steelberg and Michael L. Zemetra, the Company’s Chief Financial Officer.
On January 4, 2023, the Company entered into a consulting agreement (the “Consulting Agreement”) with Steel Holdings, LLC, an entity affiliated with Chad Steelberg. Pursuant to the Consulting Agreement, the Company retained Chad Steelberg as a consultant to provide ongoing transition services related to Ryan Steelberg’s appointment as CEO and to manage and oversee the further development of our aiWARE platform.
94
On March 10, 2023, Silicon Valley Bank (“SVB”) was closed by the California Department of Financial Protection and Innovation, which appointed the Federal Deposit Insurance Corporation (“FDIC”) as receiver. The FDIC thereafter transferred all deposits and assets of SVB to Silicon Valley Bank, N.A. (“SVBNA”), a successor bank created by the FDIC in order to protect all depositors. On March 13, 2023, the Company’s cash deposits at SVBNA became available. The Company immediately transferred the majority of its deposits to other financial institutions and began the process of fully liquidating and transferring its remaining deposits to other financial institutions.
95
Item 9. Changes in and Disagreements with Accountants on Accounting and Financial Disclosure.
None
Item 9A. Controls and Procedures.
Evaluation of Disclosure Controls and Procedures
Our management, with the participation of our Chief Executive Officer and Chief Financial Officer, evaluated the effectiveness of our disclosure controls and procedures as defined in Rules 13a-15(e) and 15d-15(e) under the Exchange Act as of the end of the period covered by this Annual Report on Form 10-K. Our disclosure controls and procedures are designed to provide reasonable assurance of achieving their objectives of ensuring that information we are required to disclose in the reports we file or submit under the Exchange Act is accumulated and communicated to our management, including our Chief Executive Officer and Chief Financial Officer, as appropriate, to enable timely decisions regarding required disclosures, and is recorded, processed, summarized, and reported within the time periods specified in the rules and forms promulgated by the SEC. Our management recognizes that any disclosure controls and procedures, no matter how well designed and operated, can provide only reasonable assurance of achieving their objectives, and there is no assurance that our disclosure controls and procedures will operate effectively under all circumstances. Based on this evaluation, our Chief Executive Officer and Chief Financial Officer have concluded that, as of December 31, 2022, our disclosure controls and procedures were not effective at the reasonable assurance level due to the following material weaknesses in internal control over financial reporting.
Management's Annual Report on Internal Control over Financial Reporting
Management's Assessment of the Effectiveness of our Internal Control over Financial Reporting
Our management is responsible for establishing and maintaining adequate internal control over financial reporting. Our internal control system is designed to provide reasonable assurance to our management and Board of Directors regarding the preparation and fair presentation of published financial statements.
Our management assessed the effectiveness of our internal control over financial reporting as of December 31, 2022. In making this assessment, it used the criteria set forth by the Committee of Sponsoring Organizations of the Treadway Commission (COSO) in Internal Control—Integrated Framework (2013). Based upon its assessment, our management believes that, as of December 31, 2022, our internal control over financial reporting was not effective due to the following material weakness in internal control over financial reporting.
Material Weaknesses in Internal Control over Financial Reporting
A material weakness is a deficiency, or a combination of deficiencies, in internal control over financial reporting, such that there is a reasonable possibility that a material misstatement of the Company’s annual or interim financial statements will not be prevented or detected on a timely basis.
During the preparation of the our Quarterly Report on Form 10-Q for the fiscal quarter ended June 30, 2022, management identified a material weakness in internal control over financial reporting relating to the appropriate oversight and sufficient review of the work performed by third-party specialists on our behalf and the coordination of work being performed by more than one specialist. Such third-party specialists were used in the preparation of (i) our valuation of Contingent Consideration, (ii) our valuation of certain identified intangible assets and (iii) our purchase price allocation pursuant to ASC 805, Business Combinations, in connection with the acquisition of PandoLogic Ltd. The material weakness resulted in the restatement of the unaudited condensed consolidated financial statements as of and for the three months ended March 31, 2022 and immaterial misstatements to the consolidated financial statements as of and for the year ended December 31, 2021. Additionally, this material weakness could have resulted in a misstatement of certain accounting estimates or disclosures that would have resulted in a material misstatement of our annual consolidated financial statements that would not have been prevented or detected on a timely basis.
During the preparation of our Annual Report on Form 10-K for the fiscal year ended December 31, 2022, management identified a material weakness in internal control over financial reporting relating to information technology general controls (“ITGCs”) in the areas of user access and change-management over certain information technology (“IT”) systems that support the Company’s financial reporting processes. In addition, the Company’s business process automated and manual controls that are dependent on the affected ITGCs were also deemed ineffective because they could have been adversely impacted. Although this material weakness did not result in any identified misstatements to the financial statements and there were no changes to previously released financial results, this material weakness could have resulted in a material
96
misstatement to the Company's annual or interim consolidated financial statements that would not be prevented or detected on a timely basis.
Grant Thornton LLP, the independent registered public accounting firm that audited the consolidated financial statements included in this Annual Report on Form 10-K, has issued an audit report on the effectiveness of the Company’s internal control over financial reporting as of December 31, 2022, which is included herein.
Remediation of Material Weaknesses in Internal Control Over Financial Reporting
In order to remediate the material weakness relating to appropriate oversight and sufficient review of the work performed by third-party specialists on our behalf and the coordination of work being performed by more than one specialist, management implemented financial reporting control changes to address the material weakness relating to the process for evaluating the qualifications of third-party specialists, defining the scope of work to be performed by such specialists and reviewing all estimates and other work product prepared by specialists in September 2022. Management has taken steps to enhance its evaluation of the qualifications of third-party specialists, more accurately define the scope of work to be performed by such specialists and improve the review process for all estimates and other work product prepared by such specialists, including a detailed review of all such specialists’ work by our employees with the appropriate level of experience and knowledge to review the specialists’ work for compliance with accounting standards. During the third and fourth quarters of 2022, we completed our testing of the operating effectiveness of the implemented controls and found them to be effective. As a result, we have concluded this material weakness has been remediated as of December 31, 2022.
In order to remediate the material weakness relating to ITGCs, management is taking remediation actions including: (i) developing and enhancing IT compliance oversight capabilities with specific focus over identification and execution of appropriate ITGCs; (ii) developing a training program addressing ITGCs and policies, including educating control owners concerning the principles and requirements of each control, with a focus on those related to user access and change management over IT systems impacting financial reporting; (iii) developing and maintaining documentation of underlying ITGCs to promote knowledge transfer upon personnel and function changes; and (iv) implementing an IT management review and testing plan to monitor ITGCs with a specific focus on systems supporting our financial reporting processes. To further remediate the existing material weaknesses identified herein, the management team, including the Chief Executive Officer and Chief Financial Officer, have reaffirmed and re-emphasized the importance of internal controls, control consciousness and a strong control environment. We are committed to maintaining a strong control environment and believe that these remediation efforts represent continued improvement in our control environment. We also expect to continue to review, optimize and enhance our financial reporting controls and procedures. A material weakness will not be considered remediated until the applicable remediated control operates for a sufficient period of time and management has concluded, through testing, that this enhanced control is operating effectively.
Changes in Internal Control over Financial Reporting
We completed the implementation of our new Enterprise Resource Planning (“ERP”) system during 2022. Accordingly, we have modified certain existing internal control processes relating to the implementation of the new ERP system. Other than the remediation efforts described above and the implementation of the new ERP system, there have been no changes in our internal control over financial reporting as defined in Rules 13a-15(f) and 15d-15(f) under the Exchange Act during the three months ended December 31, 2022 that have materially affected, or are reasonably likely to materially affect, our internal control over financial reporting.
Inherent Limitations on Effectiveness of Controls
Management recognizes that a control system, no matter how well designed and operated, can provide only reasonable, not absolute, assurance that the objectives of the control system are met. Further, the design of a control system must reflect the fact that there are resource constraints and that management is required to apply its judgment in evaluating the benefits of possible controls and procedures relative to their costs. Because of the inherent limitations in all control systems, no evaluation of controls can provide absolute assurance that all control issues and instances of fraud or error, if any, have been detected. These inherent limitations include the realities that judgments in decision making can be faulty, and that breakdowns can occur because of a simple error or mistake. Additionally, controls can be circumvented by the individual acts of some persons, by collusion of two or more people, or by management override of the controls. The design of any system of controls also is based in part upon certain assumptions about the likelihood of future events, and there can be no assurance that any design will succeed in achieving its stated goals under all potential future conditions; over time, controls may become inadequate because of changes in conditions, or the degree of compliance with policies or procedures may deteriorate. Because of the inherent limitations in a cost-effective control system, misstatements due to error or fraud may occur and not be detected.
97
98
Item 9B. Other Information.
None .
Item 9C. Disclosure Regarding Foreign Jurisdictions that Prevent Inspections.
Not applicable.
99
PART III
Item 10. Directors, Executive Officers and Corporate Governance.
We have adopted a written Code of Business Conduct and Ethics (the “Code of Conduct”) which is applicable to our directors, officers and employees, including our principal executive officer, principal financial and accounting officer, or persons performing similar functions. A copy of the Code of Conduct is available on our website at investors.veritone.com. To the extent required by rules adopted by the SEC and Nasdaq, we intend to promptly disclose on our website or in a Current Report on Form 8-K future amendments to certain provisions of the Code of Conduct, or waivers to such provisions granted to any executive officer or director.
The remaining information required by this item is incorporated herein by reference to our definitive proxy statement to be filed within 120 days of December 31, 2022 and delivered to stockholders in connection with our 2023 annual meeting of stockholders.
Item 11. Executive Compensation.
The information required by this item is incorporated herein by reference to our definitive proxy statement to be filed within 120 days of December 31, 2022 and delivered to stockholders in connection with our 2023 annual meeting of stockholders.
Item 12. Security Ownership of Certain Beneficial Owners and Management and Related Stockholder Matters.
The information required by this item is incorporated herein by reference to our definitive proxy statement to be filed within 120 days of December 31, 2022 and delivered to stockholders in connection with our 2023 annual meeting of stockholders.
The information required by this item is incorporated herein by reference to our definitive proxy statement to be filed within 120 days of December 31, 2022 and delivered to stockholders in connection with our 2023 annual meeting of stockholders.
Item 14. Principal Accountant Fees and Services.
The information required by this item is incorporated herein by reference to our definitive proxy statement to be filed within 120 days of December 31, 2022 and delivered to stockholders in connection with our 2023 annual meeting of stockholders.
100
PART IV
Item 15. Exhibits and Financial Statement Schedules.
See the index of the consolidated financial statements that are filed as part of this Annual Report on Form 10-K included in Part II, Item 8 (Financial Statements and Supplementary Data).
All financial statement schedules have been omitted because they are not applicable, not material, or the required information is included in the consolidated financial statements or the notes thereto.
The following exhibits are filed as part of this Annual Report on Form 10-K (or are incorporated by reference herein):
|
Exhibit No. |
|
Description of Exhibit |
|
|
|
2.1 |
|
|
|
|
|
2.2 |
|
|
|
|
|
3.1 |
|
|
|
|
|
3.2 |
|
|
|
|
|
4.1 |
|
|
|
|
|
4.2 |
|
|
|
|
|
4.3 |
|
Description of Registrant’s securities registered under Section 12 of the Exchange Act. |
|
|
|
4.4 |
|
|
|
|
|
10.1* |
|
|
|
|
|
10.2* |
|
|
|
|
|
10.3* |
|
|
|
|
|
10.4* |
|
|
|
|
|
10.5* |
|
|
|
|
|
10.6* |
|
101
|
Exhibit No. |
|
Description of Exhibit |
|
|
|
|
|
|
10.7* |
|
|
|
|
|
10.8* |
|
|
|
|
|
10.9* |
|
|
|
|
|
10.10* |
|
|
|
|
|
10.11* |
|
|
|
|
|
10.12* |
|
|
|
|
|
10.13* |
|
|
|
|
|
10.14* |
|
|
|
|
|
10.15* |
|
|
|
|
|
10.16* |
|
|
|
|
|
10.17* |
|
|
|
|
|
10.18* |
|
|
|
|
|
10.19* |
|
|
|
|
|
10.20* |
|
|
|
|
|
10.21* |
|
|
|
|
|
10.22* |
|
|
|
|
|
102
|
Exhibit No. |
|
Description of Exhibit |
10.23* |
|
|
|
|
|
10.24* |
|
|
|
|
|
10.25* |
|
|
|
|
|
10.26* |
|
|
|
|
|
10.27* |
|
|
|
|
|
10.28* |
|
|
|
|
|
10.29* |
|
|
|
|
|
10.30 |
|
|
|
|
|
10.31 |
|
|
|
|
|
10.32 |
|
|
|
|
|
10.33 |
|
|
|
|
|
10.34 |
|
103
|
Exhibit No. |
|
Description of Exhibit |
|
|
|
10.35 |
|
|
|
|
|
10.36 |
|
|
|
|
|
10.37 |
|
|
|
|
|
10.38 |
|
|
|
|
|
21.1 |
|
|
|
|
|
23.1 |
|
|
|
|
|
24.1 |
|
Power of Attorney (included on signature page). |
|
|
|
31.1 |
|
Certification pursuant to Rule 13a-14(a) or Rule 15d-14(a) of the Exchange Act. |
|
|
|
31.2 |
|
Certification pursuant to Rule 13a-14(a) or Rule 15d-14(a) of the Exchange Act. |
|
|
|
32.1+ |
|
|
|
|
|
101.INS |
|
Inline XBRL Instance Document |
|
|
|
101.SCH |
|
Inline XBRL Taxonomy Extension Schema Document |
|
|
|
101.CAL |
|
Inline XBRL Taxonomy Extension Calculation Linkbase Document |
|
|
|
101.DEF |
|
Inline XBRL Taxonomy Extension Definition Linkbase Document |
|
|
|
101.LAB |
|
Inline XBRL Taxonomy Extension Label Linkbase Document |
|
|
|
101.PRE |
|
Inline XBRL Taxonomy Extension Presentation Linkbase Document
|
|
|
|
104 |
|
The cover page from the Company’s Annual Report on Form 10-K for the year ended December 31, 2021, has been formatted in Inline XBRL. |
|
|
|
* |
|
Indicates a management contract or compensatory plan or arrangement. |
|
|
|
+ |
|
The certifications furnished as Exhibit 32.1 accompany this Annual Report on Form 10-K pursuant to 18 U.S.C. Subsection 1350, as adopted pursuant to Section 906 of the Sarbanes-Oxley Act of 2002, and shall not be deemed “filed” by the Registrant for purposes of Section 18 of the Exchange Act and are not to be incorporated by reference into any of the Registrant's filings under the Securities Act, irrespective of any general incorporation language contained in any such filing.. |
Item 16. Form 10-K Summary.
None.
104
SIGNATURES
Pursuant to the requirements of Section 13 or 15(d) of the Securities Exchange Act of 1934, as amended, the registrant has duly caused this Annual Report on Form 10-K to be signed on its behalf by the undersigned, thereunto duly authorized.
|
|
Veritone, Inc. |
||
|
|
|
|
|
Date: March 16, 2023 |
By: |
|
|
/s/ Ryan Steelberg |
|
|
|
|
Ryan Steelberg |
|
|
|
|
President and Chief Executive Officer |
|
|
|
|
(Principal Executive Officer) |
POWER OF ATTORNEY
KNOW ALL PERSONS BY THESE PRESENTS, that each person whose signature appears below constitutes and appoints Ryan Steelberg and Michael L. Zemetra, jointly and severally, his attorneys-in-fact, each with the power of substitution, for him in any and all capacities, to sign any amendments to this Annual Report on Form 10-K, and to file the same, with exhibits thereto and other documents in connection therewith, with the Securities and Exchange Commission, hereby ratifying and confirming all that each of said attorneys-in-fact, or his substitute or substitutes, may do or cause to be done by virtue hereof.
Pursuant to the requirements of the Securities Exchange Act of 1934, as amended, this report has been signed below by the following persons on behalf of the registrant in the capacities and on the dates indicated.
SIGNATURE |
|
TITLE |
|
DATE |
|
|
|
|
|
/s/ Ryan Steelberg |
|
President and Chief Executive Officer |
|
March 16, 2023 |
Ryan Steelberg |
|
(Principal Executive Officer) |
|
|
|
|
|
|
|
|
/s/ Michael L. Zemetra |
|
Executive Vice President, Chief Financial Officer and Treasurer |
|
March 16, 2023 |
Michael L. Zemetra |
|
(Principal Financial and Accounting Officer) |
|
|
|
|
|
|
|
/s/ Chad Steelberg |
|
Chairman of the Board and Director |
|
March 16, 2023 |
Chad Steelberg |
|
|
|
|
|
|
|
|
|
/s/ Jeff P. Gehl |
|
Director |
|
March 16, 2023 |
Jeff P. Gehl |
|
|
|
|
|
|
|
|
|
/s/ Knute P. Kurtz |
|
Director |
|
March 16, 2023 |
Knute P. Kurtz |
|
|
|
|
|
|
|
|
|
/s/ Richard H. Taketa |
|
Director |
|
March 16, 2023 |
Richard H. Taketa |
|
|
|
|
105